. 2017 Jan 24;8(1):14.
doi: 10.1186/s13287-016-0465-2.

Generation of mesenchymal stromal cells from cord blood: evaluation of in vitro quality parameters prior to clinical use

Affiliations

Generation of mesenchymal stromal cells from cord blood: evaluation of in vitro quality parameters prior to clinical use

Eliana Amati et al. Stem Cell Res Ther. .

Abstract

Background: Increasing evidence suggests the safety and efficacy of mesenchymal stromal cells (MSC) as advanced therapy medicinal products because of their immunomodulatory properties and supportive role in hematopoiesis. Although bone marrow remains the most common source for obtaining off-the-shelf MSC, cord blood (CB) represents an alternative source, which can be collected noninvasively and without major ethical concerns. However, the low estimated frequency and inconsistency of successful isolation represent open challenges for the use of CB-derived MSC in clinical trials. This study explores whether CB may represent a suitable source of MSC for clinical use and analyzes several in vitro parameters useful to better define the quality of CB-derived MSC prior to clinical application.

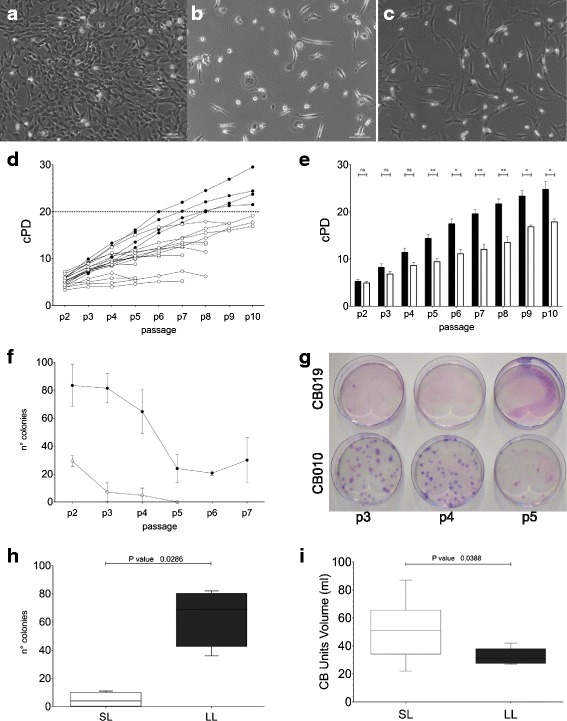
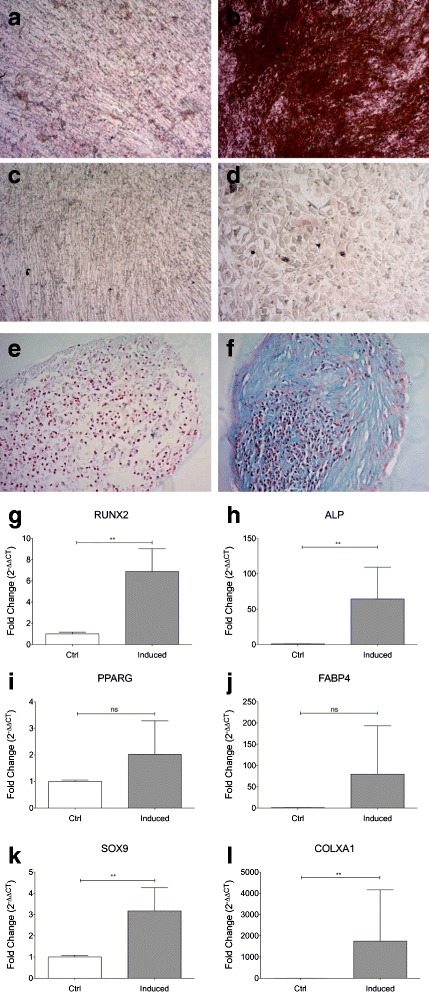
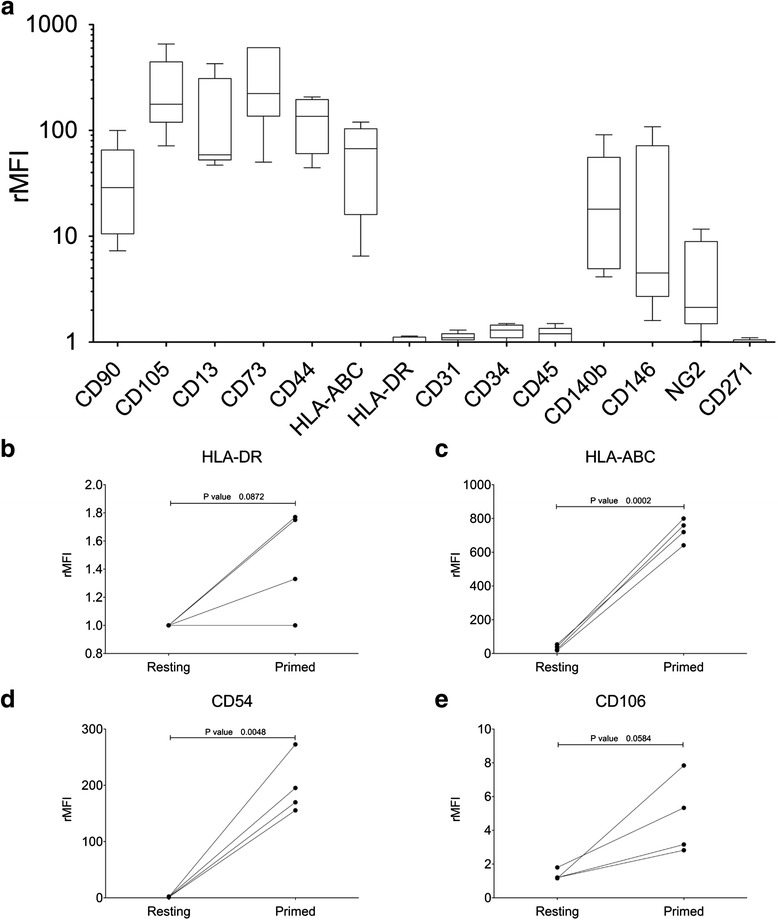
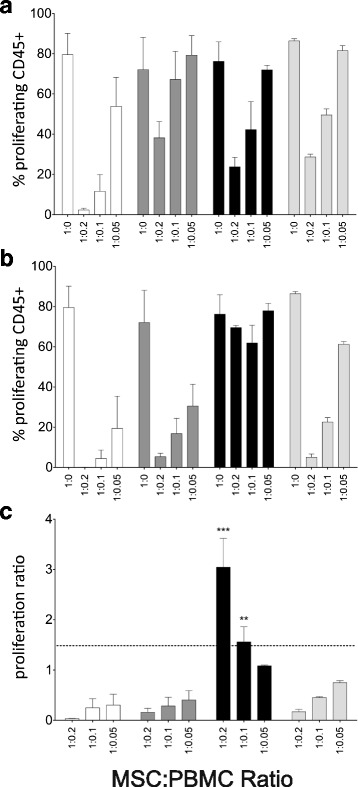
Methods: CB units (n = 50) selected according to quality criteria (CB volume ≥ 20 ml, time from collection ≤ 24 h) were cultured using a standardized procedure for CB-MSC generation. MSC were analyzed for their growth potential and secondary colony-forming capacity. Immunophenotype and multilineage differentiation potential of culture-expanded CB-MSC were assessed to verify MSC identity. The immunomodulatory activity at resting conditions and after inflammatory priming (IFN-γ-1b and TNF-α for 48 hours) was explored to assess the in vitro potency of CB-MSC prior to clinical application. Molecular karyotyping was used to assess the genetic stability after prolonged MSC expansion.

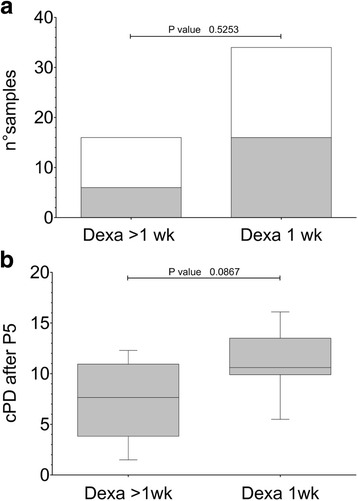
Results: We were able to isolate MSC colonies from 44% of the processed units. Our results do not support a role of CB volume in determining the outcome of the cultures, in terms of both isolation and proliferative capacity of CB-MSC. Particularly, we have confirmed the existence of two different CB-MSC populations named short- and long-living (SL- and LL-) CBMSC, clearly diverging in their growth capacity and secondary colony-forming efficiency. Only LL-CBMSC were able to expand consistently and to survive for longer periods in vitro, while preserving genetic stability. Therefore, they may represent interesting candidates for therapeutic applications. We have also observed that LL-CBMSC were not equally immunosuppressive, particularly after inflammatory priming and despite upregulating priming-inducible markers.

Conclusions: This work supports the use of CB as a potential MSC source for clinical applications, remaining more readily available compared to conventional sources. We have provided evidence that not all LL-CBMSC are equally immunosuppressive in an inflammatory environment, suggesting the need to include the assessment of potency among the release criteria for each CB-MSC batch intended for clinical use, at least for the treatment of immune disorders as GvHD.


Figures

Fig. 1
Fig. 1
Effect of dexamethasone on CB-MSC culture outgrowths. a Effects of two different treatment regimens with DEXA (>1 wk or 1 wk, n = 16 and n = 34, respectively) on CB-MSC isolation (n = 6 and n = 16, respectively). Gray color: positive MSC isolation. White color: negative MSC isolation. The differences were computed by Fisher exact test, p > 0.05. b Comparison of cumulative population doubling (cPD) at P5 between CB-MSC isolated by adding DEXA for > 1wk or 1 wk (n = 6 and n = 15, respectively). The differences were computed by Mann-Whitney U test, p > 0.05. Boxes extend from 25th percentile to the 75th percentile, the middle line represents median value and the whiskers extend from minimum to maximum values. Abbreviations: cPD cumulative population doublings, DEXA dexamethasone, wk week
Fig. 2
Fig. 2
Morphology and growth characteristics of CB-MSC. a Colony of CB-MSC 10 days after initial seeding (passage 0). b Non-proliferative fibroblast-like cells and osteoclast-like cells, the latter with very large cytoplasm and occasional multiple nuclei (passage 0). c Morphology of CB-MSC at passage P1. Scale bars: 100 μM. d Growth patterns of CB-MSC grouped by similar cPD (cPD cutoff = 20 at P9). Black circles: LL-CBMSC; white circles: SL-CBMSC. e Comparison of cPD between LL- (black bars) and SL- (white bars) CBMSC at each passage; the differences were computed by Mann-Whitney U test, * p < 0.05, ** p < 0.01, *** p < 0.001; data are presented as mean with SEM. f Secondary colony formation of LL-CBMSC (black circles) and SL-CBMSC (white circles) at defined passages. g Colonies formed after plating 200 MSC in 100-mm culture dishes are shown from one representative LL- and one SL-CBSMC (CB010 and CB019, respectively). h Secondary colony formation of LL-CBMSC (black boxes) and SL-CBMSC (white boxes) at P4. The differences were computed by Mann-Whitney U test, p < 0.05. Boxes extend from 25th percentile to the 75th percentile, the middle line represents median value and the whiskers extend from minimum to maximum values. i Comparison between CB volumes between LL-CBMSC and SL-CBMSC (n = 5 and n = 16, respectively); the differences were computed by Mann-Whitney U test, p < 0.05. Abbreviations: LL-CBMSC long-living CBMSC, SL-CBMSC short-living CBMSC, NS not significant
Fig. 3
Fig. 3
Multilineage differentiation of CB-MSC. Multilineage ability was determined in P4 LL-CBMSC. a-f Panels display cells which have been induced to differentiate in vitro toward osteogenic (a-b), adipogenic (c-d), and chondrogenic (e-f) lineages. Osteogenic and adipogenic differentiation were assessed after 21 days of induction using von Kossa and Oil Red O staining, respectively; ×10 magnification. Chondrogenesis was evaluated by Alcian Blue staining at day 28 of induction; cells were counterstained with Nuclear Fast Red solution; ×20 magnification. For each staining, undifferentiated controls are also displayed on the left (panels a-c-e). g Quantitative RT-PCR analysis of osteogenic markers RUNX2 and ALP (g-h), adipogenic markers PPARG and FABP4 (i-j), and chondrogenic markers SOX9 and COLXA1 (k-l) in cells cultured under the respective lineage induction conditions. Results are presented as the fold change in mRNA expression in respect to TBP as representative reference gene and to the undifferentiated control. The mean values from three independent experiments done in triplicate are shown. The differences were computed by paired t test or Wilcoxon matched pairs test as appropriate, p values: ** p < 0.01. Abbreviations: NS not significant
Fig. 4
Fig. 4
Immunophenotypic analysis of CB-MSC. a Characterization of LL-CBMSC (n = 5) by flow cytometry using a panel of 14 cell surface markers. Boxes extend from 25th percentile to the 75th percentile, the middle line represents median value and the whiskers extend from minimum to maximum values. Data are displayed as rMFI on the unstained control. b-e Phenotypic modifications induced on LL-CBMSC (n = 4) by inflammatory stimuli, i.e., treatment with 10 ng/ml IFN-γ-1b and 15 ng/ml TNF-α for 48 hours before staining with the appropriate mAb combination. Data are expressed as rMFI with respect to the FMO control. P values <0.05 were considered statistically significant. Abbreviations: rMFI relative median fluorescence intensity, FMO fluorescence-minus-one, mAb monoclonal antibody
Fig. 5
Fig. 5
Immunosuppressive properties of CB-MSC. a-b Inhibitory effect of resting (a) and primed (b) LL-CBMSC on allogeneic CFSE-labeled PBMC. Cells were co-cultured at different PBMC:MSC ratios upon PBMC stimulation with anti-CD3 and rh-IL-2 for 6 days. Three different PBMC:MSC ratios were used ranging from 1:0.2 to 1:0.05. The 1:0 ratio represents the positive control (no MSC treatment and presence of PBMC antibody stimulation). Proliferation was assessed by CFSE dilution method on CD45+ cells. Each bar represents mean and SEM of two independent experiments with two different PBMC donors for each of four CB-MSC batches. c Proliferation ratio between the percentage of CD45+ proliferation at primed and resting conditions, at the different MSC doses. The differences were computed by two-way ANOVA, ** p < 0.01, *** p < 0.001

References

    1. Dominici M, et al. Minimal criteria for defining multipotent mesenchymal stromal cells. The International Society for Cellular Therapy position statement. Cytotherapy. 2006;8(4):315–317. doi: 10.1080/14653240600855905. - DOI - PubMed
    1. Aggarwal S, Pittenger MF. Human mesenchymal stem cells modulate allogeneic immune cell responses. Blood. 2005;105(4):1815–1822. doi: 10.1182/blood-2004-04-1559. - DOI - PubMed
    1. Uccelli A, Moretta L, Pistoia V. Immunoregulatory function of mesenchymal stem cells. Eur J Immunol. 2006;36(10):2566–2573. doi: 10.1002/eji.200636416. - DOI - PubMed
    1. Nauta AJ, Fibbe WE. Immunomodulatory properties of mesenchymal stromal cells. Blood. 2007;110(10):3499–3506. doi: 10.1182/blood-2007-02-069716. - DOI - PubMed
    1. Krampera M. Mesenchymal stromal cell ‘licensing’: a multistep process. Leukemia. 2011;25(9):1408–1414. doi: 10.1038/leu.2011.108. - DOI - PubMed

MeSH terms

LinkOut - more resources