. 2017 Jan 1;31(1):59-71.
doi: 10.1101/gad.286963.116. Epub 2017 Jan 23.

Targeted CRISPR disruption reveals a role for RNase MRP RNA in human preribosomal RNA processing

Affiliations

Targeted CRISPR disruption reveals a role for RNase MRP RNA in human preribosomal RNA processing

Katherine C Goldfarb et al. Genes Dev. .

Abstract

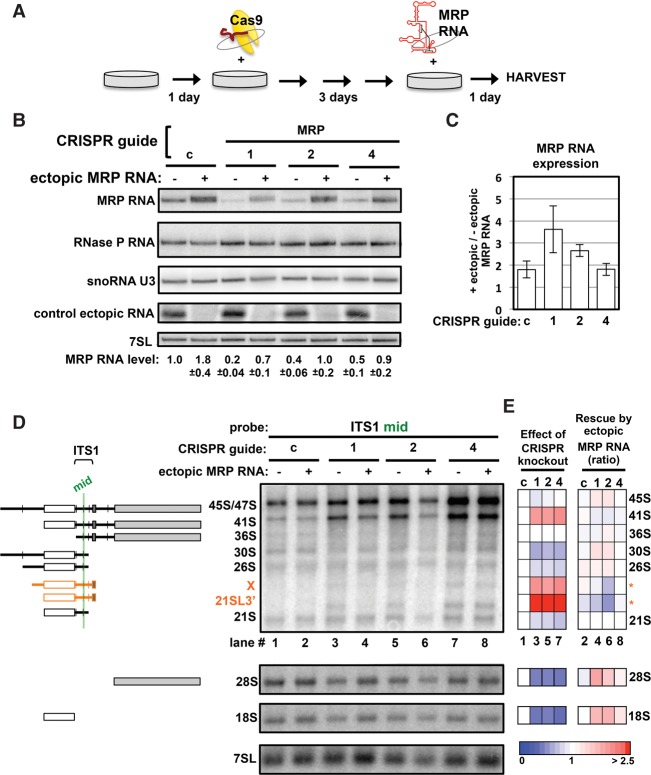
MRP RNA is an abundant, essential noncoding RNA whose functions have been proposed in yeast but are incompletely understood in humans. Mutations in the genomic locus for MRP RNA cause pleiotropic human diseases, including cartilage hair hypoplasia (CHH). Here we applied CRISPR-Cas9 genome editing to disrupt the endogenous human MRP RNA locus, thereby attaining what has eluded RNAi and RNase H experiments: elimination of MRP RNA in the majority of cells. The resulting accumulation of ribosomal RNA (rRNA) precursor-analyzed by RNA fluorescent in situ hybridization (FISH), Northern blots, and RNA sequencing-implicates MRP RNA in pre-rRNA processing. Amelioration of pre-rRNA imbalance is achieved through rescue of MRP RNA levels by ectopic expression. Furthermore, affinity-purified MRP ribonucleoprotein (RNP) from HeLa cells cleaves the human pre-rRNA in vitro at at least one site used in cells, while RNP isolated from cells with CRISPR-edited MRP loci loses this activity, and ectopic MRP RNA expression restores cleavage activity. Thus, a role for RNase MRP in human pre-rRNA processing is established. As demonstrated here, targeted CRISPR disruption is a valuable tool for functional studies of essential noncoding RNAs that are resistant to RNAi and RNase H-based degradation.

Keywords: CRISPR–Cas9; RMRP; RNase MRP; RNase P; preribosomal RNA processing.


Figures

Figure 1.
Figure 1.
The MRP RNA locus is efficiently edited by CRISPR–Cas9 in human cells. (A) Schematic of the RMRP locus and the MRP RNA secondary structure. Numbers 1–4 designate the CRISPR-mediated cut sites described in this work. (Yellow arrowheads) Positions where CRISPR-mediated cleavages map to RMRP and to the RNA secondary structure; (blue arrows) PCR primers used in B. (B) PCR amplicons of genomic DNA from control and edited populations of HeLa cells 33 h after transfection of CRISPR–Cas9 machinery. CRISPR guides targeting the cut sites described in A are indicated for each reaction. (C) Representative sequence traces of gel-purified PCR amplicons from two lanes of B. (Top panel [“lane 1”]) The unique RMRP sequence is observed across the population of HeLa cells treated with nontargeting CRISPR guide. (Bottom panel [“lane 5”]) Different indels at the cut site present in the RMRP guide-treated population cause superposition of multiple sequences. For the genotypes of individual clonal lines, see Supplemental Figure S2.
Figure 2.
Figure 2.
CRISPR editing of RMRP abolishes MRP RNA expression and inhibits cell proliferation. (A) Growth characteristics of cells cloned after CRISPR–Cas9 treatment. Colonies were identified at day 5 and then photographed again at days 10–14. “Proliferating” colonies had cell proliferation greater than the field of view (1.1 mm × 0.8 mm) by day 14, and “slow/no proliferation” colonies had as many as 50 cells by day 14 or as few as the same number cells as on day 5. Error bars indicate the range of two biological replicates, analyzing at least 50 clones for each guide. (B) Example “proliferating” colonies (left and right panels) and “slow/no proliferation” colonies (middle panels). Bar, 400 µm. “Escaped” refers to a colony that eluded CRISPR disruption. (C) RNA FISH of the bottom panels in B with MRP RNA in red, DAPI-stained nuclei in blue, and mitochondria (mt) in gray. Bar, 30 µm. For comparison with siRNA depletion, see Supplemental Figure S1.
Figure 3.
Figure 3.
Pre-rRNA accumulates in cells void of MRP RNA. (A) Two-color RNA FISH of representative control and RMRP-edited colonies with MRP RNA in red, DAPI-stained nuclei in blue, 5.8S rRNA in green, and mitochondria (mt) in pink (to distinguish mitochondrial signal from the cytoplasmic rRNA signal). (Escaped) A colony that eluded CRISPR disruption; (arrested) a colony that ceased to proliferate. (B) Two-color RNA FISH as in A except with ITS1 probe B in green and mitochondria (mt) in gray. The schematic in the middle indicates where the green probes for A and B hybridize to the pre-rRNA. Mature rRNAs are depicted in white (18S), dark gray (5.8S), and light gray (28S). (Mixed population) The polyclonal MRP RNA-depleted population discussed in the text. (Yellow outlines) Two example cells that illustrate anti-correlated MRP RNA and ITS1 signals. Bar, 20 µm. Larger fields of view are shown in Supplemental Figure S3.
Figure 4.
Figure 4.
CRISPR removal of MRP RNA in HeLa populations impacts steady-state expression of rRNA precursors. (A) Northern analysis from composite HeLa populations treated 4 d before harvest with control or RMRP targeting CRISPR guides 1, 2, and 4. Mean MRP RNA level relative to the nontargeting control guide is given with the standard error for six biological replicates. (c) Nontargeting control guide. (B) Northern analysis of mature rRNAs from HeLa populations in A. Mean 28S and 18S rRNA levels relative to the nontargeting control guide are given with the standard error for three biological replicates. (7SL) Loading control. (C) Northern analysis of rRNA precursors from HeLa populations in A. (Left) The schematic indicates where Northern probes (green) align within the ITS1 of pre-rRNA and the approximate composition of each RNA species. (Orange diagrams and asterisks) Noncanonical precursors that are stabilized in the absence of MRP RNA; (X) previously unidentified precursor containing intact ITS1, with the predicted composition depicted. (D) Quantification of rRNA precursors in C. The heat map depicts the fold change of each precursor relative to its level with the nontargeting control guide (shown in lane c). Average fold change for six biological replicate blots. (White) 1.0; a level equal to the control; (gray hatched boxes) RNAs that are not observable with the ITS1 probe indicated. Heat maps and fold change values for individual replicate blots are in Supplemental Figure S4. (E) RNA sequencing (RNA-seq) read coverage across mature and precursor rRNA for MRP RNA-depleted and control cells. Read coverage was determined by the number of reads that aligned to a given region, scaled to the total reads that aligned to the entire full-length pre-rRNA for each sample indicated. The 5.8S and 3′ ETS were further scaled to enable graphing on the same axes since these had 100-fold lower coverage than the other mature or precursor regions, respectively. (F) Individual nucleotide coverage of RNA-seq reads for MRP RNA-depleted and control cells. The read coverage at every nucleotide along the rRNA precursor (X-axis) was first scaled to total number of reads that mapped to the entire rRNA precursor for each sample. This scaled coverage for each MRP RNA-depleted library was further normalized to the average of control samples at that nucleotide position to achieve the relative coverage at each nucleotide position. Only relative coverage at least threefold greater than average control samples is shown. (Bottom panel [“all”]) Nucleotide positions that are at least threefold enriched in all MRP RNA-depleted replicates over control replicates. Vertical lines on the schematic at the bottom indicate the approximate positions of endonucleolytic cleavages. Lines below the X-axis on each graph indicate nucleotide positions with zero coverage in at least one control sample (purple), zero coverage in both control samples (pink), and zero coverage in all samples (bright green).
Figure 5.
Figure 5.
Exogenous expression of MRP RNA restores pre-rRNA processing in cells disrupted at RMRP. (A) Schematic for ectopic MRP RNA expression after CRISPR–Cas9 treatment. Plasmids encoding Cas9 and CRISPR guides were transfected 3 d before a plasmid for ectopic MRP RNA expression driven by the human RMRP promoter. Details are described in the Materials and Methods. (B) Northern analysis from composite HeLa populations treated according to the schematic in A with ectopic MRP RNA (+) or a plasmid that expresses a control RNA sequence driven by the same RMRP promoter (−; control ectopic RNA). Mean MRP RNA level relative to the nontargeting control guide is given with the standard error for four biological replicates. (c) Nontargeting control guide. (C) MRP RNA levels increase after ectopic expression of MRP RNA. Error bars indicate the standard error of the mean for four biological replicates. (D) Northern analysis of mature and precursor rRNAs from HeLa populations in B. (Left) The schematic indicates where the “mid” Northern probe (green) aligns within the ITS1 of pre-rRNA and the approximate composition of the pre-rRNAs labeled. (Orange) Noncanonical precursors that are stabilized in the absence of MRP RNA and partially depleted with ectopic MRP RNA expression. (E) Quantification of rRNA precursors in D. (Orange asterisks) Noncanonical precursors defined in D. (Left heat map) The effect of MRP RNA disruption in the absence of ectopic MRP RNA expression (as in Fig. 4D). (Right heat map) The effect of ectopic MRP RNA expression shown as the ratio of each RNA species with or without ectopic MRP RNA. Both heat maps present the mean fold changes for five biological replicate blots. Heat maps and fold change values for individual replicate blots are in Supplemental Figure S4C.
Figure 6.
Figure 6.
Affinity-purified MRP RNP cleaves a pre-rRNA substrate at site 2 in vitro. (A) Immunopurification and elution of MRP/P RNPs from cells transfected with 3xFlag-tagged protein constructs. (L) Whole-cell lysate; (F) flowthrough of material not bound to beads; (e) Flag peptide elution from beads; (hPOP1, Rpp30, and Rpp20) representative proteins of the MRP/P RNP; (RNA polymerase II [RNAPII] and snoRNA U3) specificity controls for the immunoprecipitation; (GFP transfection) a control for perturbations caused by transfection and for contaminating activities from the beads or elution conditions. (B) Composition of MRP/P RNPs from cells cotransfected with CRISPR guides and 3xFlag-Rpp25. (G) GFP transfection as in A; (c) control guide. Size markers are indicated at the right in kilodaltons for protein blots (top five panels) and DNA base pairs for RNA blots (bottom panel). (C) In vitro cleavage of pre-tRNATYR by the RNPs eluted in A and B. Full-length (FL) pre-tRNA is indicated in gray, the 5′ cleavage product is indicated in white, and the 3′ (mature) product is indicated in black. The slender arrow highlights the RNase P cleavage site. (D) In vitro cleavage of human pre-rRNA ITS1 substrate by the RNPs eluted in A and B. The schematic highlights the placement of the ITS1 substrate (gray bar) within the rRNA precursor. The slender vertical arrow indicates the site 2 cleavage site observed in cells (Supplemental Figure S7), and white and black designate the 5′ and 3′ cleavage products, respectively. Bar, 50 nt. Additional affinity purifications with activity assays as well as activity assays with extended pre-rRNA substrates are in Supplemental Figures S5, S6, and S8.
Figure 7.
Figure 7.
Expression of ectopic MRP RNA restores cleavage of pre-rRNA in vitro. (A) Ectopic MRP RNA expression assessed by Northern analysis. Lysates were prepared as per Figure 5A, with the exception that the plasmid containing 3xFlag-Rpp25 was cotransfected with the CRISPR machinery (see the Materials and Methods). The mean ratio of MRP RNA to RNase P RNA is indicated for comparison with the elution in B, with the standard error for three biological replicate experiments. (B) Northern analysis of 3xFlag peptide elutions from anti-Flag immunoprecipitations performed with the lysates in A. The ratios of MRP RNA to RNase P RNA indicate that ectopic MRP RNA is immunoprecipitated along with endogenous MRP RNA. Mean ratios are given with the standard error for three biological replicate experiments. (C) In vitro cleavage of pre-tRNATYR by the RNPs eluted in A and B. Full-length (FL) pre-tRNA is indicated in gray, the 5′ cleavage product is indicated in white, and the 3′ (mature) product is indicated in black. The slender arrow highlights the RNase P cleavage site. The bar graph quantifies 5′ product formation as a proxy for cleavage activity. Error bars indicate the standard error of four replicate assays. (n.s.) Nonsignificant; (*) P = 0.03. (D) In vitro cleavage of human pre-rRNA ITS1 substrate by the RNPs eluted in A and B. Black lines indicate where intervening lanes have been removed. The schematic highlights the placement of the ITS1 substrate (gray bar) within the rRNA precursor. The slender arrow indicates the site 2 cleavage site, and white and black designate the 5′ and 3′ cleavage products, respectively. Bar for schematic, 50 nt. The bar graph below quantifies 5′ product formation as a proxy for cleavage activity. Error bars indicate the standard error of the mean for four (control guide) and six (RMRP targeting guides) replicate assays. (**) P < 0.01; (***) P < 0.001; (n.s.) nonsignificant. A shorter exposure of each gel with all bands unsaturated was used for quantification.

References

    1. Altman S, Smith JD. 1971. Tyrosine tRNA precursor molecule polynucleotide sequence. Nat New Biol 233: 35–39. - PubMed
    1. Amar L, Desclaux M, Faucon-Biguet N, Mallet J, Vogel R. 2006. Control of small inhibitory RNA levels and RNA interference by doxycycline induced activation of a minimal RNA polymerase III promoter. Nucleic Acids Res 34: e37. - PMC - PubMed
    1. Barrangou R, Birmingham A, Wiemann S, Beijersbergen RL, Hornung V, Smith Av. 2015. Advances in CRISPR–Cas9 genome engineering: lessons learned from RNA interference. Nucleic Acids Res 43: 3407–3419. - PMC - PubMed
    1. Chang DD, Clayton DA. 1987. A novel endoribonuclease cleaves at a priming site of mouse mitochondrial DNA replication. EMBO J 6: 409–417. - PMC - PubMed
    1. Chu S, Archer RH, Zengel JM, Lindahl L. 1994. The RNA of RNase MRP is required for normal processing of ribosomal RNA. Proc Natl Acad Sci 91: 659–663. - PMC - PubMed

Publication types

MeSH terms