. 2017 Apr;361(1):87-98.
doi: 10.1124/jpet.116.238378. Epub 2017 Jan 23.

Early Detection of Acute Drug-Induced Liver Injury in Mice by Noninvasive Near-Infrared Fluorescence Imaging

Affiliations

Early Detection of Acute Drug-Induced Liver Injury in Mice by Noninvasive Near-Infrared Fluorescence Imaging

Kristine O Vasquez et al. J Pharmacol Exp Ther. 2017 Apr.

Abstract

Hepatocellular and cholestatic forms of drug-induced liver injury (DILI) are major reasons for late-stage termination of small-molecule drug discovery research projects. Biochemical serum markers are limited in their ability to sensitively and specifically detect both of these common DILI forms in preclinical models, and tissue-specific approaches to assessing this are labor intensive, requiring extensive animal dosing, tissue preparation, and pathology assessment. In vivo fluorescent imaging offers noninvasive detection of biologic changes detected directly in the livers of living animals. Three different near-infrared fluorescent imaging probes, specific for cell death (Annexin-Vivo 750), matrix metalloproteases (MMPSense 750 FAST), and transferrin receptor (Transferrin-Vivo 750) were used to measure the effects of single bolus intraperitoneal doses of four different chemical agents known to induce liver injury. Hepatocellular injury-inducing agents, thioacetamide and acetaminophen, showed optimal injury detection with probe injection at 18-24 hours, the liver cholestasis-inducing drug rifampicin required early probe injection (2 hours), and chlorpromazine, which induces mixed hepatocellular/cholestatic injury, showed injury with both early and late injection. Different patterns of liver responses were seen among these different imaging probes, and no one probe detected injury by all four compounds. By using a cocktail of these three near-infrared fluorescent imaging probes, all labeled with 750-nm fluorophores, each of the four different DILI agents induced comparable tissue injury within the liver region, as assessed by epifluorescence imaging. A strategy of probe cocktail injection in separate cohorts at 2 hours and at 20-24 hours allowed the effective detection of drugs with either early- or late-onset injury.


Figures

Fig. 1.
Fig. 1.
Comparison of three optical imaging strategies for detecting liver fluorescence. APAP-treated (500 mg/kg) and control male C57BL/6 mice were injected 24 hours later with AV-750 and fluorescent images were acquired 2 hours later on the IVIS SpectrumCT. (A) Representative images are shown of one treated animal and one control animal by 2D epifluorescence (upper panel), 2D transillumination fluorescence (middle panel), and 3D fluorescence tomography (lower panel), and ROIs were placed to capture the signal in the liver and kidneys. Control region ROIs (not shown) were placed in the depilated right flank region for background subtraction. (B) Quantification of the liver and kidney AV-750 fluorescent signal was determined in treated and control mice for each of the fluorescent imaging approaches. Bkg, background control region; L, left; R, right; ROI, region of interest.
Fig. 2.
Fig. 2.
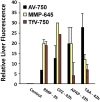
Assessment of four chemical compounds and three imaging probes in liver injury imaging. Whole-mouse ventral epifluorescence imaging was used to detect accumulation of AV-750, MMP-645, and TfV-750 in the liver regions of different cohorts of mice at different times post-treatment. Mice (n = 3 per group) were injected intraperitoneally with the indicated drug doses and then injected intravenously with imaging probes at the indicated times (2, 5, 18/22, and 42 hours). Whole-body epifluorescence images were acquired on the IVIS SpectrumCT 2 hours after AV-750 treatment or 24 hours after MMP-645 and TfV-750 treatment. Representative individual mice are shown for each drug/probe combination, with the same mouse represented longitudinally, and this experiment is representative of three independent studies. White boxes indicate the liver regions quantified, and red-outlined yellow boxes show the optimal probe injection times post-treatment.
Fig. 3.
Fig. 3.
Multiple fluorescent probe profiling in the liver response to chemical insult. Quantification of the liver signal from noninvasive imaging in Fig. 2 was determined using 2D region-of-interest placement positioned to capture and quantify the fluorescent signal in the liver region. Results are represented for the optimal probe/time point conditions as fold above background after standard 90% background thresholding to best illustrate profile trends for the different treatments.
Fig. 4.
Fig. 4.
Validation of a three-probe fluorescent cocktail for general detection of DILI. A cocktail of three imaging probes (AV-750, MMP-750, and TfV-750) was optimized for 24-hour imaging in mice treated with all four drugs (n = 3 per group). Drug-dosed mice were injected with the imaging cocktail at two different times post-treatment (18 hours for TAA and APAP; 2 hours for CPZ and RMP), and all mice were imaged 24 hours after AMT-750 for both noninvasive liver assessment (upper left panel) and ex vivo tissues (lower left panel). Epifluorescence images of mice (left panel) of mice receiving optimal doses of RMP, CPZ, APAP, or TAA show liver region signal in comparison with control mice. Quantification of the liver signal from noninvasive imaging (upper right panel) and the ex vivo liver and kidney signal (lower right panel) were determined by region-of-interest placement to capture the entire liver or individual tissues, and results were represented as the total liver fluorescent signal ± S.E. Statistical significance was assessed by analysis of variance with the Dunnett post-test (*P < 0.01; **P < 0.001; #P < 0.05; n = 3). Results are representative of multiple studies using either multiplex or individual probe imaging.
Fig. 5.
Fig. 5.
Mouse acute liver injury screening paradigm. Depilated male BALB/c or C57BL/6 mice (Charles River Laboratories) were injected intraperitoneally with DILI-inducing drugs. Separate cohorts of mice, at 2 and 18–24 hours post-treatment, were then injected with imaging probes (AMT-750 and AS-680) for imaging 24 hours later to detect biologic changes within damaged tissue. IP, intraperitoneal.
Fig. 6.
Fig. 6.
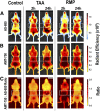
Ratio of AMT-750 to vascular leak (AS-680) to correct for nonspecific accumulation of AMT-750 in tissues. Mice (n = 3 per group) pretreated with TAA or RMP were coinjected with the AMT-750 cocktail and AS-680, a well established vascular leak imaging probe, to allow normalization of AMT-750 data. Whole-mouse epifluorescence imaging was used to detect accumulation of the 680-nm and 750-nm probes in the liver regions of different cohorts of mice post-treatment. (A and B) Epifluorescence images of AS-680 signal (A) and AMT-750 signal (B) (middle panel) in controls and in treated mice at two times post-treatment. (C) Normalized ratio images (AMT-750/AS-680) were generated on IVIS SpectrumCT Living Image 4.5 software. White boxes indicate the liver regions analyzed for fluorescent signal. Results are representative of three studies using probe cocktail imaging.
Fig. 7.
Fig. 7.
Quantification of AMT-750/AS-680 ratios for quantification of DILI. Single-channel quantification of the liver region fluorescence signal from noninvasive imaging was determined by region-of-interest placement to capture the entire liver. Results are represented with 90% of the negative control liver signal subtracted. (A) Results from the AMT-750 signal (upper panel) and the AS-680 signal (lower panel) are represented as background-corrected average total radiant efficiency. (B) Ratio analysis of AMT-750 to AS-680, using Living Image 4.5 image math functions, was performed to correct AMT-750 results for nonspecific vascular leak contribution to the overall signal. Results are expressed as ratios of AMT-750 to AS-680 subsequently normalized to set average control ratios to 1. Statistical significance was assessed by analysis of variance with the Dunnett post-test (*P < 0.01; **P < 0.001; #P < 0.05; n = 3). BKG, background signal levels.
Fig. 8.
Fig. 8.
Ex vivo AMT-750 and AS-680 imaging of excised tissues from control, RMP-treated, and TAA-treated mice. (A–C) Single-channel images of excised liver, brain, lung, heart, stomach, skin, fat, spleen, pancreas, intestine, and kidney tissues were acquired for control (A), RMP treatment (B), and TAA treatment (C) with both AS-680 (upper panels) and AMT-750 (lower panels) imaging probes. Images were acquired for the optimal time points for each treatment: 2 hours for RMP and 24 hours for TAA. AMT-750 images were optimized for liver visualization, which led to saturation of the kidney signal (mostly due to known kidney clearance of AV-750). Insets provide optimized images for the kidney, revealing an enhanced signal in kidneys from RMP-treated mice.
Fig. 9.
Fig. 9.
Quantification of fluorescence in excised tissues from control, RMP-treated, and TAA-treated mice. Regions of interest were placed to quantify fluorescence levels in the liver, brain, lung, heart, stomach, skin, fat, spleen, pancreas, intestine, and kidney tissues from control, TAA-treated, and RMP-treated mice that had been injected with both AS-680 and AMT-750. (A–C) AS-680 (A), AMT-750 (B), and AMT-750/AS-680 ratio (C) fluorescence datasets were quantified, and data were normalized . Results are represented as ratio to control ± S.E.M., and statistical significance was assessed by analysis of variance with the Dunnett post-test (*P < 0.01; **P < 0.001; #P < 0.05; n = 3). Results are representative of multiple studies using either multiplex or individual probe imaging.
Fig. 10.
Fig. 10.
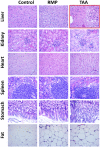
Histologic assessment of tissues from control, RMP-treated, and TAA-treated mice. Liver, kidney, heart, spleen, stomach, and fat tissues were collected from control, RMP-treated, and TAA-treated BALB/c mice. Tissues were fixed in 10% neutral buffered formalin for 24 hours at 20°C, followed by storage in 70% ethanol. Tissues were then embedded in paraffin, sectioned (4 µm), and stained with hematoxylin and eosin for general evaluation of pathologic changes. Results were assessed by a pathologist, and the only gross abnormality seen across the range of tissues was moderate necrosis induced by TAA (see red-outlined image).

Similar articles

Cited by

References

    1. Ackerman Z, Pappo O, Link G, Glazer M, Grozovski M. (2015) Liver toxicity of thioacetamide is increased by hepatocellular iron overload. Biol Trace Elem Res 163:169–176. - PubMed
    1. Ahuja V, Sharma S. (2014) Drug safety testing paradigm, current progress and future challenges: an overview. J Appl Toxicol 34:576–594. - PubMed
    1. al-Bader A, Mathew TC, Khoursheed M, Asfar S, al-Sayer H, Dashti HM. (2000) Thioacetamide toxicity and the spleen: histological and biochemical analysis. Anat Histol Embryol 29:3–8. - PubMed
    1. Al-Olayan EM, El-Khadragy MF, Aref AM, Othman MS, Kassab RB, Abdel Moneim AE. (2014) The potential protective effect of Physalis peruviana L. against carbon tetrachloride-induced hepatotoxicity in rats is mediated by suppression of oxidative stress and downregulation of MMP-9 expression. Oxid Med Cell Longev 2014:381413. - PMC - PubMed
    1. Amacher DE, Adler R, Herath A, Townsend RR. (2005) Use of proteomic methods to identify serum biomarkers associated with rat liver toxicity or hypertrophy. Clin Chem 51:1796–1803. - PubMed

Publication types