. 2017 Mar;173(3):1692-1708.
doi: 10.1104/pp.16.01743. Epub 2017 Jan 23.

The IQD Family of Calmodulin-Binding Proteins Links Calcium Signaling to Microtubules, Membrane Subdomains, and the Nucleus

Affiliations

The IQD Family of Calmodulin-Binding Proteins Links Calcium Signaling to Microtubules, Membrane Subdomains, and the Nucleus

Katharina Bürstenbinder et al. Plant Physiol. 2017 Mar.

Abstract

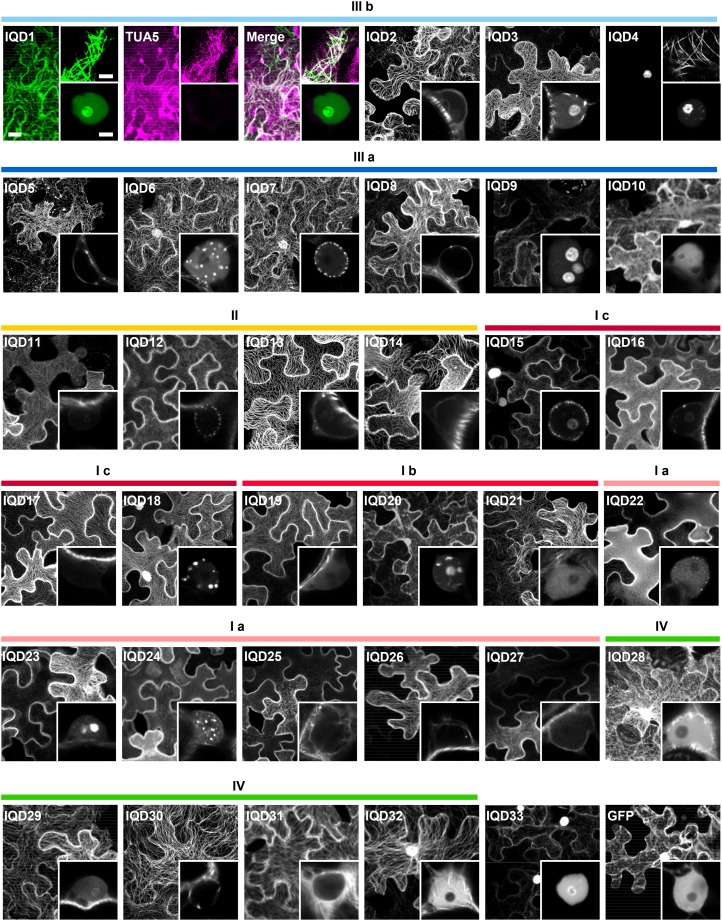
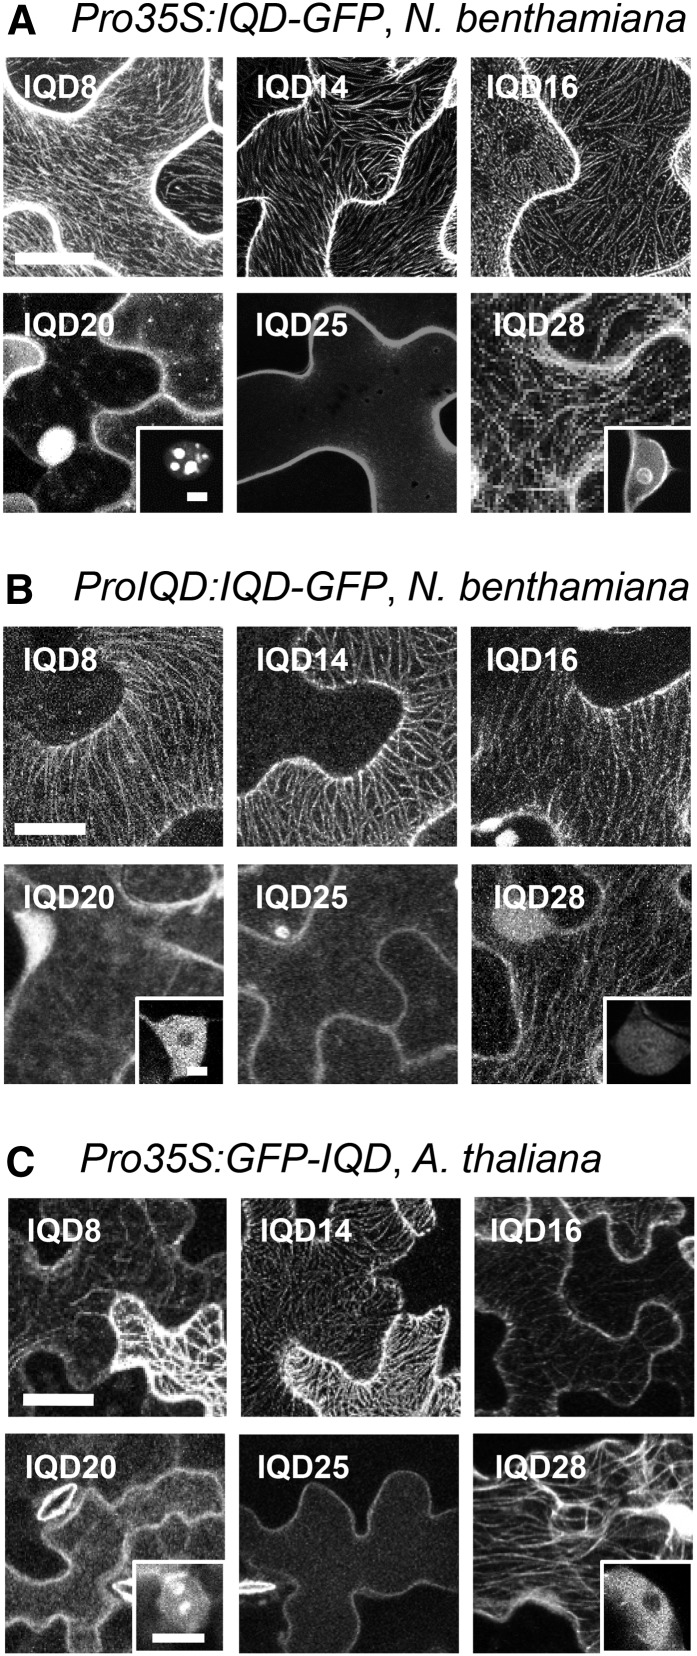
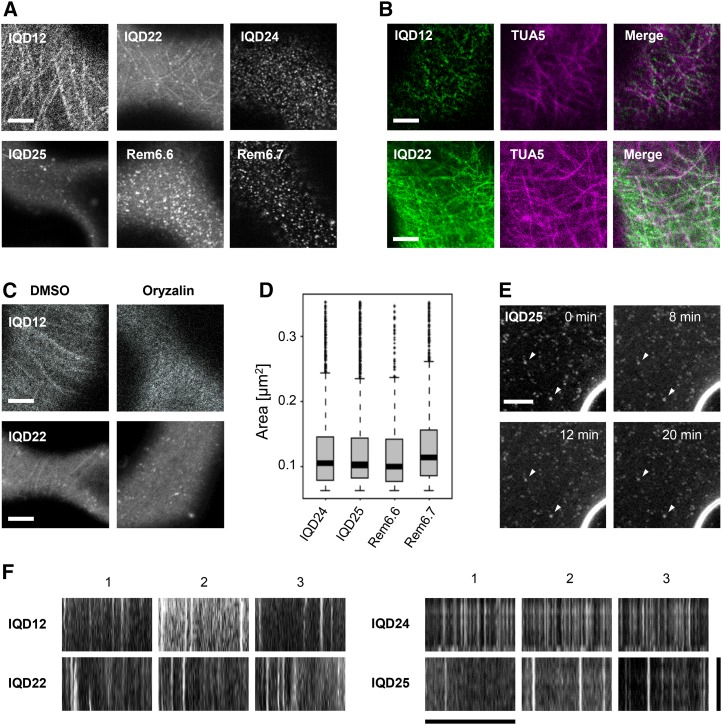
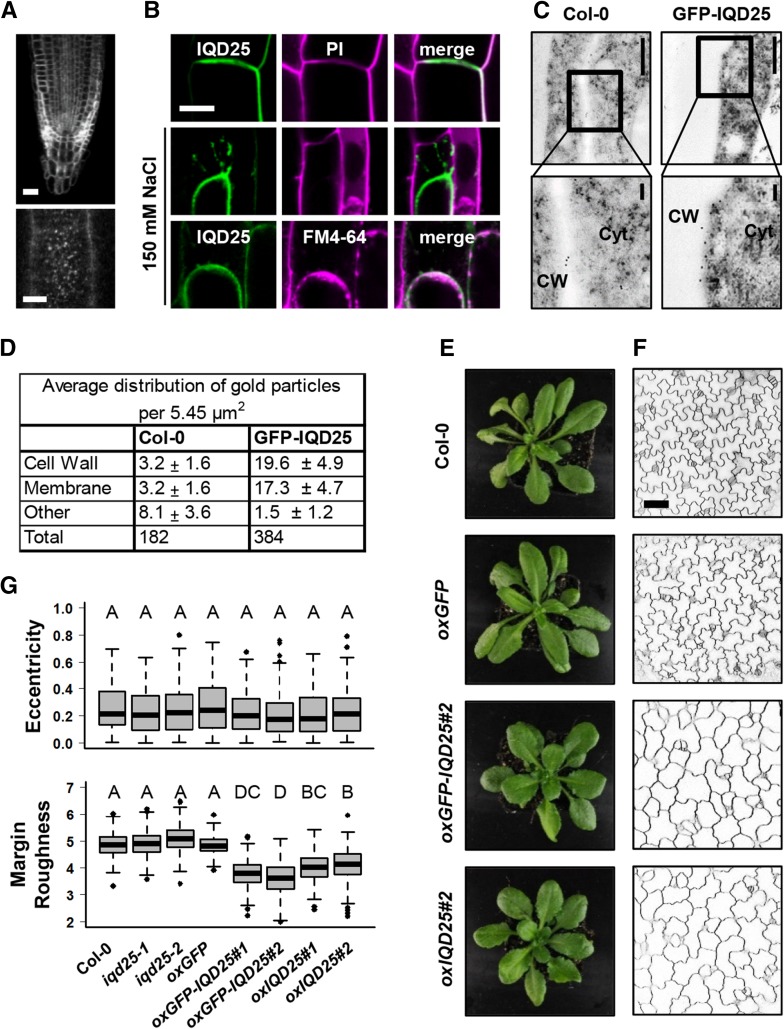
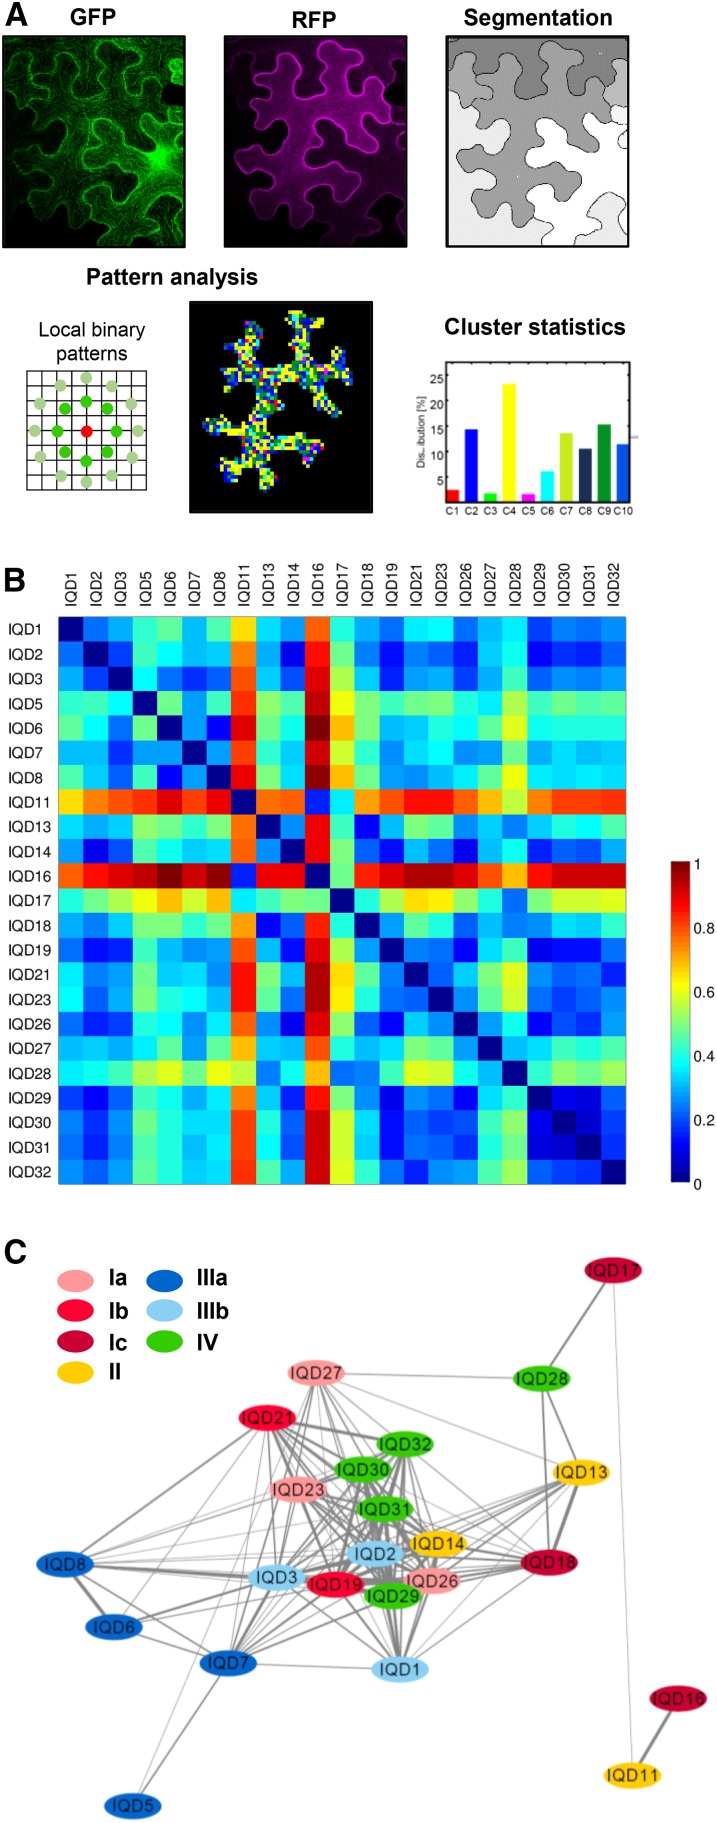
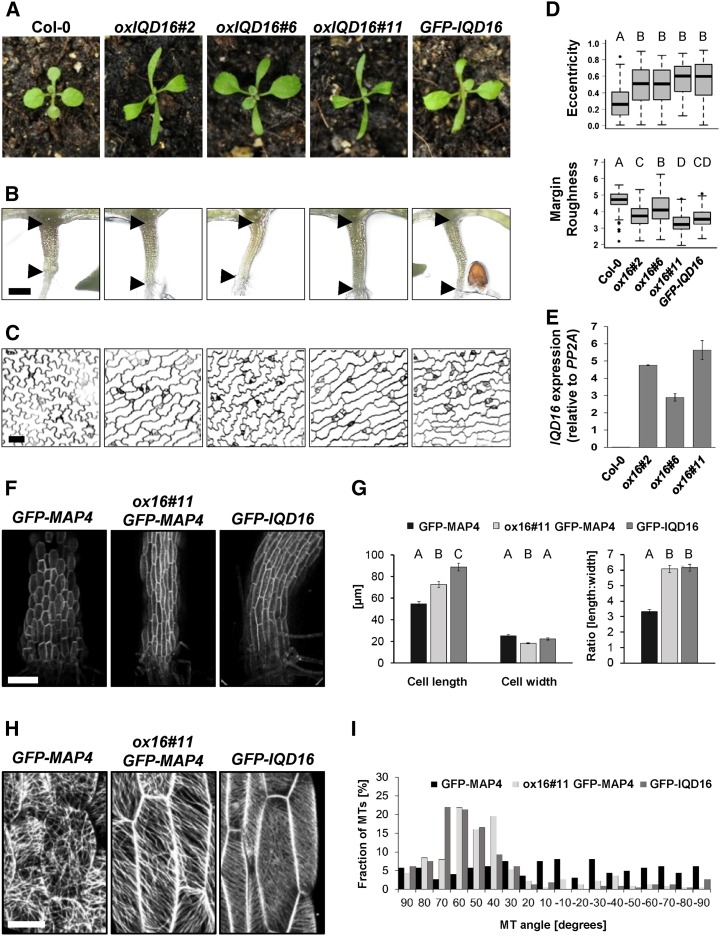
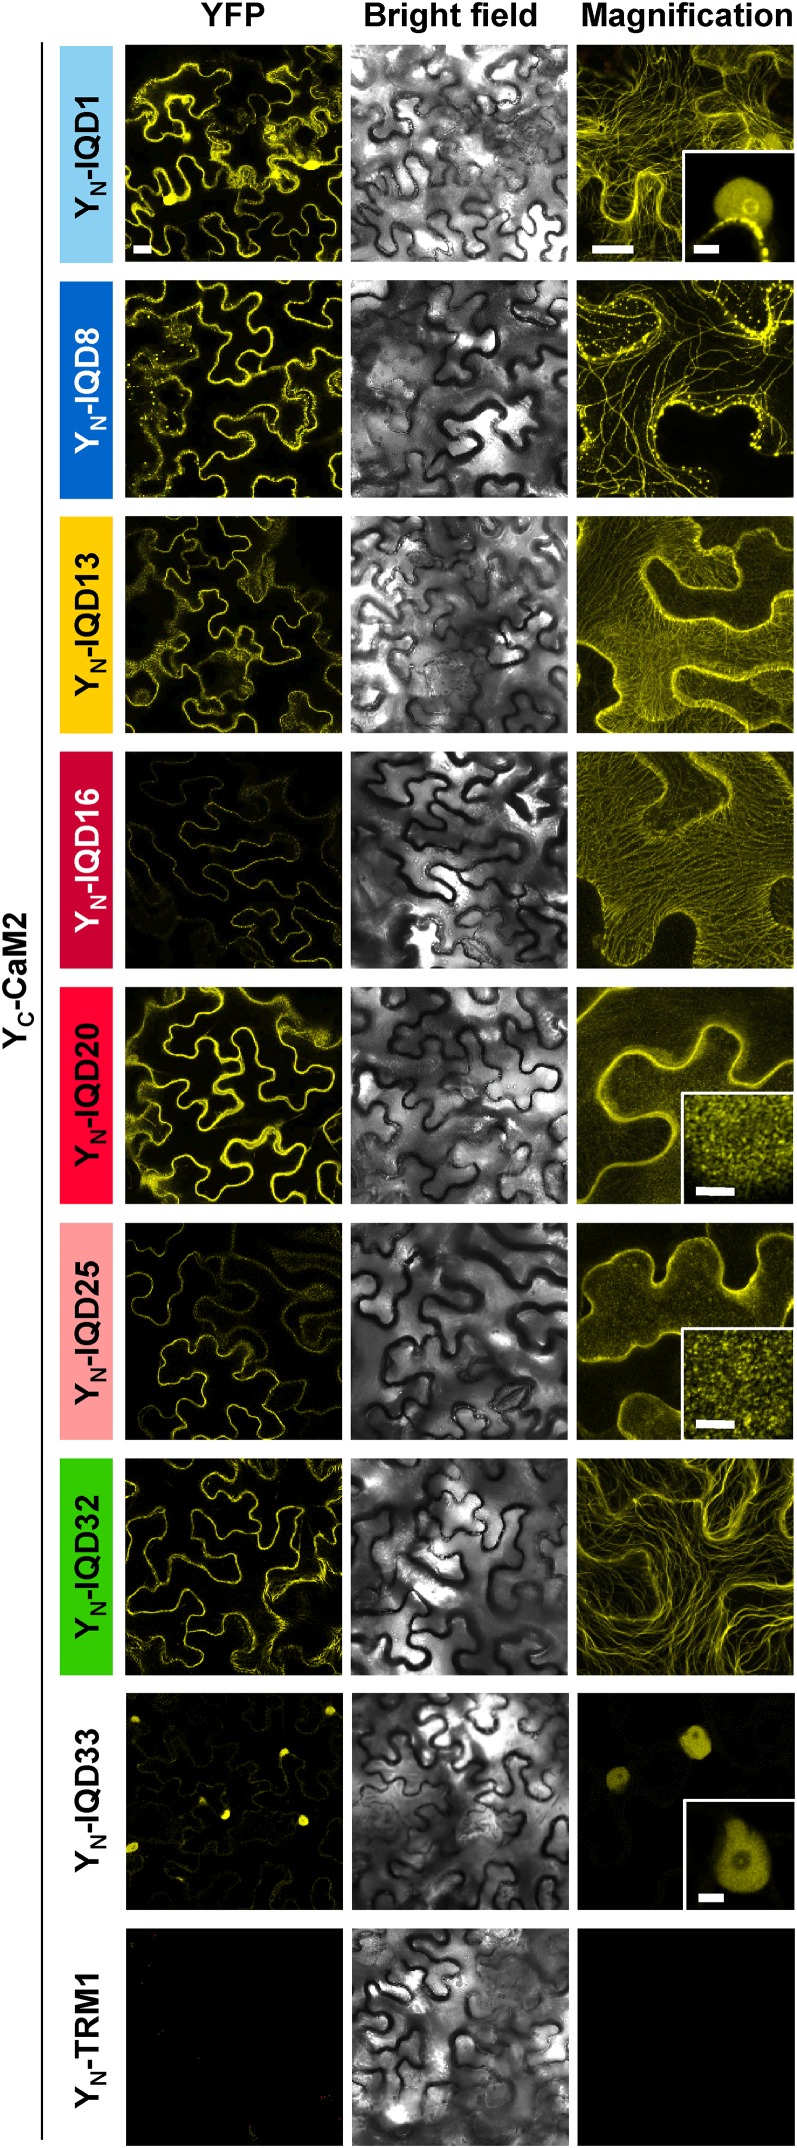
Calcium (Ca2+) signaling and dynamic reorganization of the cytoskeleton are essential processes for the coordination and control of plant cell shape and cell growth. Calmodulin (CaM) and closely related calmodulin-like (CML) polypeptides are principal sensors of Ca2+ signals. CaM/CMLs decode and relay information encrypted by the second messenger via differential interactions with a wide spectrum of targets to modulate their diverse biochemical activities. The plant-specific IQ67 DOMAIN (IQD) family emerged as possibly the largest class of CaM-interacting proteins with undefined molecular functions and biological roles. Here, we show that the 33 members of the IQD family in Arabidopsis (Arabidopsis thaliana) differentially localize, using green fluorescent protein (GFP)-tagged proteins, to multiple and distinct subcellular sites, including microtubule (MT) arrays, plasma membrane subdomains, and nuclear compartments. Intriguingly, the various IQD-specific localization patterns coincide with the subcellular patterns of IQD-dependent recruitment of CaM, suggesting that the diverse IQD members sequester Ca2+-CaM signaling modules to specific subcellular sites for precise regulation of Ca2+-dependent processes. Because MT localization is a hallmark of most IQD family members, we quantitatively analyzed GFP-labeled MT arrays in Nicotiana benthamiana cells transiently expressing GFP-IQD fusions and observed IQD-specific MT patterns, which point to a role of IQDs in MT organization and dynamics. Indeed, stable overexpression of select IQD proteins in Arabidopsis altered cellular MT orientation, cell shape, and organ morphology. Because IQDs share biochemical properties with scaffold proteins, we propose that IQD families provide an assortment of platform proteins for integrating CaM-dependent Ca2+ signaling at multiple cellular sites to regulate cell function, shape, and growth.


Figures

Figure 1.
Figure 1.
Subcellular localization of Arabidopsis GFP-IQD fusion proteins in N. benthamiana. N-terminal GFP fusions of all Arabidopsis IQD family members (IQD1–IQD33) were transiently expressed under the control of the CaMV 35S promoter in N. benthamiana leaves. Colored bars above the images indicate the phylogenetic clades (Abel et al., 2005). MT colocalization of GFP-IQDs was confirmed by coexpression with RFP-TUA5 (shown for GFP-IQD1), and GFP alone was used as a reference (bottom right image). Micrographs of cells are projections of Z-stacks; insets are single-layer images of cell nuclei. Extra insets (GFP-IQD1 and GFP-IQD4) are single-layer images of MTs, which for GFP-IQD4 reveal MT localization only with increased laser intensities. Bars = 20 µm and 5 µm (insets).
Figure 2.
Figure 2.
Independent verification of subcellular localization patterns of select Arabidopsis IQD family members. A and B, Subcellular localization of C-terminal GFP fusions of IQD proteins expressed under the control of the CaMV 35S promoter (A) or their endogenous regulatory elements (B) in N. benthamiana leaf epidermis cells. C, Subcellular localization of N-terminal GFP fusions of IQD proteins transiently expressed under the control of the CaMV 35S promoter in Arabidopsis leaf epidermis cells. Micrographs are projections of Z-stacks, and insets are single-layer images of nuclei. Bars = 20 µm and 5 µm (insets).
Figure 3.
Figure 3.
IQD proteins label PM subdomains in N. benthamiana. A, Imaging of the upper surface of N. benthamiana leaf epidermis cells expressing Pro-35S:GFP-IQD fusions or the PM subdomain markers Pro-35S:GFP-Rem6.6 and Pro-35S:GFP-Rem6.7. B, Filamentous structures labeled by IQD12 and IQD22 aligned along MTs, as demonstrated by coexpression with RFP-TUA5. C, Depolymerization of MTs by oryzalin treatment abolishes the accumulation of IQD12 and IQD22 in filamentous structures. Bars in A to C = 5 µm. D, Quantification of domain size labeled by GFP-tagged IQD24, IQD25, Rem6.6, and Rem6.7. Data are medians of 10 independent images, and boxes range from first to third data quartiles. E, For kymographs, stacks of 10 to 14 images were acquired over 20 min in intervals of 2 min. Arrowheads indicate individual GFP-IQD25-labeled punctate structures within the PM, which remain stable over 20 min. Bar = 5 µm. F, Kymographs were created from three independent time-lapse movies (1, 2, and 3) of cells expressing GFP-tagged IQD12, IQD22, IQD24, or IQD25. Vertical lines indicate that the PM subdomains are highly immobile. Bars = 20 µm (horizontal) and 20 min (vertical).
Figure 4.
Figure 4.
Subcellular localization and phenotypes in transgenic Pro-35S:GFP-IQD25 Arabidopsis seedlings. A to C, Root cells of 4-d-old transgenic Arabidopsis seedlings expressing GFP-IQD25 under the control of the CaMV 35S promoter. A, Subcellular localization of GFP-IQD25 in a primary root tip (top) and surface imaging of root epidermis cells (bottom). Bars = 20 µm (top) and 5 µm (bottom). B, PM localization of GFP-IQD25. GFP-IQD25 localizes to the cell outline, as demonstrated by colocalization with the cell wall dye PI in root cells. After plasmolysis with 150 mm NaCl, GFP-IQD25 fluorescence is detached from PI-stained cell walls and colocalizes with FM4-64-stained PM. C, Localization of GFP-IQD25 by immunogold labeling and transmission electron microscopy. Bottom images are magnifications of the framed regions in the top images. CW, Cell wall; Cyt, cytosol. Bars = 0.5 µm (top) and 0.1 µm (bottom). D, Quantification of gold particles in 10 independent sections. A significant enrichment of gold particles at the PM and cell wall was observed in GFP-IQD25 when compared with the wild-type control (Columbia-0 [Col-0]). E and F, Phenotypes of wild-type, Pro-35S:IQD25, Pro-35S:GFP-IQD25, and Pro-35S:GFP transgenic seedlings. E, Shoots of 4-week-old plants grown on soil under long-day conditions. F, Single optical sections are shown for cotyledon epidermal cells (adaxial side) of 5-d-old seedlings grown under sterile conditions. Cell outlines were visualized with PI. Bar = 50 µm. G, Quantification of cellular elongation (eccentricity) and of the (ir)regularity/(non)smoothness of the cell contour (margin roughness). Results are medians from n ≥ 90 cells and n ≥ 3 seedlings, and boxes range from first to third quartiles. Different letters denote a significant statistical difference. P < 0.005 by one-way ANOVA.
Figure 5.
Figure 5.
Quantification and network analysis of MT patterns in N. benthamiana epidermis cells. A, Workflow of MT pattern analysis. PI-stained cell outlines were imaged in the red channel for cell segmentation, and GFP-IQD-labeled MTs were recorded in the green channel. Texture features were extracted from local binary patterns, and groups of patterns were defined by cluster analysis. B, Heat map showing pairwise distances between MT patterns. The heat map was normalized to a range of [0,1], with blue colors representing high similarity and distances close to 0 and red colors representing high dissimilarity and distances close to 1. The color bar shown encodes the similarity strength. C, Network analysis of MT patterns induced by the overexpression of GFP-IQD fusions. Nodes represent average MT patterns of individual IQD members. Node colors highlight the phylogenetic groups and subgroups, and the width of the connecting lines is proportional to the similarity between the nodes.
Figure 6.
Figure 6.
IQD16 overexpression alters epidermal cell shape and cortical MT orientation. A to C, Phenotypes of Arabidopsis wild-type plants and IQD16-overexpressing plants grown under long-day conditions. Shown are representative images of shoots of the wild type (Col-0), three independent transgenic Pro-35S:IQD16 lines (ox16#2, ox16#6, and ox16#11), and one transgenic Pro-35S:GFP-IQD16 line (GFP-IQD16). A, Two-week-old plants grown on soil. B, Seven-day-old seedlings grown under sterile conditions. Arrowheads delimit hypocotyls, which are elongated in IQD16-overexpressing plants. Bar = 0.5 mm. C, Single optical sections of adaxial epidermal pavement cells in cotyledons of 5-d-old seedlings. Cell walls were visualized with PI. Bar = 50 µm. D, Quantification of the cellular eccentricity and margin roughness in cells shown in C. Results are medians from n ≥ 70 cells and n ≥ 3 seedlings, and boxes range from first to third quartiles. Different letters denote a significant statistical difference. P < 0.005 by one-way ANOVA. E, Quantitative reverse transcription (RT)-PCR analysis of IQD16 transcript levels relative to PP2A in the three individual Pro-35S:IQD16 transgenic lines shown in A in comparison with the wild type (Col-0). Results are averages of three replicates ± se. F and G, Analysis of MT organization and cell shape in transgenic seedlings expressing Pro-35S:GFP-MAP4 (GFP-MAP4), Pro-35S:IQD16 and Pro-35S:GFP-MAP4 (oxIQD16#11 GFP-MAP4), or Pro-35S:GFP-IQD16 (GFP-IQD16). Seedlings of stably transformed Arabidopsis lines (5 d old) were grown on Arabidopsis salt medium under long-day conditions. F, Z-stack projections of hypocotyl epidermis cells. Bar = 100 µm. G, Epidermal hypocotyl cell size. Cell length and cell width were measured relative to the perpendicular axis, and the length-to-width ratio of individual cells was calculated (means ± se, n = 33 cells of three seedlings; Different letters denote a significant statistical difference. P < 0.005 by Student’s t test). H, Z-stack projections of individual epidermal hypocotyl cells. Bar = 20 µm. I, Quantification of cortical MT orientation. Angles were measured relative to the perpendicular axis, and relative fractions were calculated (n = 225 MTs, with three independent experiments).
Figure 7.
Figure 7.
IQD11 and IQD14 overexpression lines display altered plant growth and MT orientation. A, Phenotypes of Arabidopsis wild-type and transgenic plants overexpressing IQD11 and IQD14. Shown are representative images of shoots of 2-week-old plants grown under long-day conditions from the wild type (Col-0) and transgenic Pro-35S:IQD11 (oxIQD11), Pro-35S:YFP-IQD11 (YFP-IQD11), Pro-35S:IQD14 (oxIQD14), and Pro-35S:GFP-IQD14 (GFP-IQD14) lines. B, Subcellular localization of GFP-IQD16, YFP-IQD11, GFP-IQD14, GFP-MAP4, and GFP-ABD2 fusion proteins in seedlings treated with dimethyl sulfoxide (DMSO) or with the MT-depolymerizing drug oryzalin. Seedlings of transgenic Arabidopsis lines (5 d) were grown on Arabidopsis salt medium under long-day conditions. Micrographs are Z-stack projections of epidermal hypocotyl cells. Bar = 20 µm. C, Quantification of cortical MT orientation (Fig. 6). D, Epidermal pavement cell shape in the wild type and in transgenic Pro-35S:YFP-IQD11 and Pro-35S:GFP-IQD14 lines. Single optical sections show adaxial epidermal pavement cells in cotyledons from 5-d-old seedlings. Cell walls were visualized with PI. Bar = 50 µm. E, Quantification of the cellular eccentricity and margin roughness in cells. Results are medians from n ≥ 90 cells and n ≥ 4 seedlings, and boxes range from first to third quartiles. Different letters denote a significant statistical difference. P < 0.001 by one-way ANOVA.
Figure 8.
Figure 8.
IQD proteins interact with CaM2 at MTs, at the PM, and in the nucleus. Single optical sections of BiFC signals (left column) and corresponding bright-field images (center column) as well as closeup Z-stack images of YFP fluorescence (right column) are shown for N. benthamiana epidermis cells after coexpression of IQD proteins N-terminally tagged with the N-terminal half of Venus (YN) and CaM2 N-terminally tagged with the C-terminal half of Venus (YC). Insets in the right column show nuclei or the membrane surface. YN-TRM1 was used as a negative control. Bars = 50 µm (left column), 20 µm (right column), and 5 µm (insets).

Comment in

  • On the Inside.
    Minorsky PV. Minorsky PV. Plant Physiol. 2017 Mar;173(3):1527-1528. doi: 10.1104/pp.17.00218. Plant Physiol. 2017. PMID: 28258119 Free PMC article. No abstract available.

References

    1. Abel S, Bürstenbinder K, Müller J (2013) The emerging function of IQD proteins as scaffolds in cellular signaling and trafficking. Plant Signal Behav 8: e24369. - PMC - PubMed
    1. Abel S, Savchenko T, Levy M (2005) Genome-wide comparative analysis of the IQD gene families in Arabidopsis thaliana and Oryza sativa. BMC Evol Biol 5: 72. - PMC - PubMed
    1. Amari K, Boutant E, Hofmann C, Schmitt-Keichinger C, Fernandez-Calvino L, Didier P, Lerich A, Mutterer J, Thomas CL, Heinlein M, et al. (2010) A family of plasmodesmal proteins with receptor-like properties for plant viral movement proteins. PLoS Pathog 6: e1001119. - PMC - PubMed
    1. Babu MM, van der Lee R, de Groot NS, Gsponer J (2011) Intrinsically disordered proteins: regulation and disease. Curr Opin Struct Biol 21: 432–440 - PubMed
    1. Benschop JJ, Mohammed S, O’Flaherty M, Heck AJR, Slijper M, Menke FLH (2007) Quantitative phosphoproteomics of early elicitor signaling in Arabidopsis. Mol Cell Proteomics 6: 1198–1214 - PubMed

Publication types

MeSH terms