. 2017 Feb 7;114(6):1317-1322.
doi: 10.1073/pnas.1616443114. Epub 2017 Jan 23.

A semisynthetic organism engineered for the stable expansion of the genetic alphabet

Affiliations

A semisynthetic organism engineered for the stable expansion of the genetic alphabet

Yorke Zhang et al. Proc Natl Acad Sci U S A. .

Abstract

All natural organisms store genetic information in a four-letter, two-base-pair genetic alphabet. The expansion of the genetic alphabet with two synthetic unnatural nucleotides that selectively pair to form an unnatural base pair (UBP) would increase the information storage potential of DNA, and semisynthetic organisms (SSOs) that stably harbor this expanded alphabet would thereby have the potential to store and retrieve increased information. Toward this goal, we previously reported that Escherichia coli grown in the presence of the unnatural nucleoside triphosphates dNaMTP and d5SICSTP, and provided with the means to import them via expression of a plasmid-borne nucleoside triphosphate transporter, replicates DNA containing a single dNaM-d5SICS UBP. Although this represented an important proof-of-concept, the nascent SSO grew poorly and, more problematically, required growth under controlled conditions and even then was unable to indefinitely store the unnatural information, which is clearly a prerequisite for true semisynthetic life. Here, to fortify and vivify the nascent SSO, we engineered the transporter, used a more chemically optimized UBP, and harnessed the power of the bacterial immune response by using Cas9 to eliminate DNA that had lost the UBP. The optimized SSO grows robustly, constitutively imports the unnatural triphosphates, and is able to indefinitely retain multiple UBPs in virtually any sequence context. This SSO is thus a form of life that can stably store genetic information using a six-letter, three-base-pair alphabet.

Keywords: CRISPR; Cas9; DNA replication; nucleotide transporter; unnatural base pair.


Conflict of interest statement

Y.Z., B.M.L., and F.E.R. have filed a patent application based on the use of Cas9 for enforced retention of the UBP. Y.Z. and F.E.R. have filed a patent application for the truncated transporter. F.E.R. has a financial interest (shares) in Synthorx Inc., a company that has commercial interests in the UBP. The other authors declare no other competing financial interests.

Figures

Fig. 1.
Fig. 1.
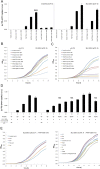
UBPs and transporter optimization. (A) Chemical structure of the dNaM-d5SICS and dNaM-dTPT3 UBPs with a natural dC–dG base pair included for comparison. (B) Comparison of fitness and [α-32P]-dATP uptake in DM1 and the various constructed strains: pCDF and inducible PtNTT2(1–575) (gray); pSC and constitutive PtNTT2(66–575) (blue); and chromosomally integrated and constitutive PtNTT2(66–575) (green). The promoters from which PtNTT2 is expressed are indicated by the labels next to their corresponding markers. Open triangles denote corresponding control strains without PtNTT2. The pCDF plasmids are in E. coli C41(DE3); pSC plasmids and integrants are in E. coli BL21(DE3). All PtNTT2 strains are non-codon-optimized for plasmid-based expression and codon-optimized for chromosomal expression unless otherwise indicated; r.d.u. is relative decay units, which corresponds to the total number of radioactive counts per minute normalized to the average OD600 across a 1-h window of uptake, with the uptake in DM1 induced with 1,000 µM IPTG set to 1 (Materials and Methods for additional details). Error bars represent SD of the mean, n = 3 cultures grown and assayed in parallel; the error bars on some data points are smaller than their marker.
Fig. S1.
Fig. S1.
The dATP uptake and growth of cells expressing PtNTT2 as a function of inducer (IPTG) concentration or promoter strength, strain background, and presence of N-terminal signal sequences. (A) Uptake of [α-32P]-dATP in strains with inducible PtNTT2. Error bars represent SD of the mean, and n = 3 cultures; r.d.u. is relative decay units, which corresponds to the total number of radioactive counts per minute normalized to the average OD600 across a 1-h window of uptake, with the uptake of C41(DE3) pCDF-1b PtNTT2(1-575) (i.e., DM1) induced with 1,000 µM IPTG set to 1. Deletion of the N-terminal signal sequences drastically reduces uptake activity in C41(DE3), but activity can be restored with higher levels of expression in BL21(DE3). (B) Growth curves of C41(DE3) strains. Induction of PtNTT2(1-575) is toxic. (C) Growth curves of BL21(DE3) strains. Induction of T7 RNAP in BL21(DE3) is toxic (see empty vector traces), which masks the effect of deleting the N-terminal signal sequences of PtNTT2 on cell growth. (D) Uptake of [α-32P]-dATP in strains that constitutively express PtNTT2(66-575) from the indicated promoters. (E) Growth curves of plasmid-based and chromosomally integrated transporter strains. All PtNTT2 strains are non-codon-optimized for plasmid-based expression and codon-optimized for chromosomal expression, unless otherwise indicated. Strain YZ4 also contains a chromosomally integrated Cas9 gene.
Fig. 2.
Fig. 2.
UBP retention assay and the effects of transporter and UBP optimization. (A) Schematic representation of the biotin shift assay used to determine UBP retention. The plasmid DNA to be analyzed is first amplified in a PCR supplemented with the unnatural triphosphates, and the resulting products are then incubated with streptavidin and subjected to PAGE analysis. X = dNaM, or, in the PCR, its biotinylated analog dMMO2biotin. Y = d5SICS in the PCR, whereas Y = dTPT3 or d5SICS in the plasmid DNA, depending on the experimental conditions. Lane 1 is the product from the oligonucleotide analogous to that used to introduce the UBP during plasmid assembly, but with the UBP replaced by a natural base pair (negative control). This band serves as a marker for DNA that has lost the UBP. Lane 2 is the product from the synthetic oligonucleotide containing the UBP that was used for plasmid assembly. The shift of this band serves as a marker for the shift of DNA containing the UBP. Lane 3 is the product from the in vitro-assembled plasmid before SSO transformation (positive control). The unshifted band results from DNA that has lost the UBP during in vitro plasmid assembly. Lane 4 is the product from an in vivo replication experiment. (B) UBP retentions of plasmids pUCX1, pUCX2, and pBRX2 in strains DM1 and YZ3. Error bars represent SD of the mean, n = 4 transformations for pUCX1 and pUCX2, n = 3 for DM1 pBRX2, and n = 5 for YZ3 pBRX2. (C) UBP retentions of pUCX2 variants, wherein the UBP is flanked by all possible combinations of natural nucleotides (NXN, where N = d(G, C, A, or T) and X = dNaM), in strain YZ3 grown in media supplemented with either dNaMTP and d5SICSTP (gray bars) or dNaMTP and dTPT3TP (black bars).
Fig. S2.
Fig. S2.
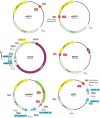
Plasmid maps. Promoters and terminators are denoted by white and gray features, respectively; pMB1* denotes the derivative of the pMB1 origin from pUC19, which contains a mutation that increases its copy number (41). Plasmids that contain a UBP are generally indicated with the TK1 sequence (orange), but, as described in Results and Discussion and indicated above, pUCX2 and pAIO variants with other UBP-containing sequences also position the UBP in the approximate locus shown with TK1 above; sgRNA (N) denotes the guide RNA that recognizes a natural substitution mutation of the UBP, with N being the nucleotide present in the guide RNA; sgRNA (∆) denotes the guide RNA that recognizes a single nucleotide deletion of the UBP; this sgRNA and its associated promoter and terminator (indicated by ‡) are only present in certain experiments. serT and gfp do not have promoters.
Fig. S3.
Fig. S3.
Additional characterization of UBP propagation. (A) Growth curves for the experiments shown in Fig. 2B. YZ3 and DM1 (induced with 1 mM IPTG) were transformed with the indicated UBP-containing plasmids, or their corresponding fully natural controls, and grown in media containing dNaMTP and d5SICSTP. Each line represents one transformation and subsequent growth in liquid culture. The x axis represents time spent in liquid culture, excluding the 1 h of recovery following electroporation (Materials and Methods). Growth curves terminate at the OD600 at which cells were collected for plasmid isolation and analysis of UBP retention. Staggering of the curves along the x axis for replicates within a given strain and plasmid combination is likely due to minor variability in transformation frequencies between transformations (and thus differences in the number of cells inoculated into each culture), whereas differences in slope between curves indicate differences in fitness. Growth of YZ3 is comparable between all three UBP-containing plasmids (and between each UBP-containing plasmid and its respective natural control), whereas growth of DM1 is impaired by the UBP-containing plasmids, especially for pUCX1 and pUCX2. (B) Retentions of gfp pUCX2 variants propagated in YZ3 by transformation, plating on solid media, isolation of single colonies, and subsequent inoculation and growth in liquid media, in comparison with retentions from plasmids propagated by transformation and growth of YZ3 in liquid media only. Cells were plated from the same transformations used in the experiments for Fig. 2C. Solid and liquid media both contained dNaMTP and dTPT3TP. Cells were harvested at OD600 of ∼1. Five colonies were inoculated for each of the pUCX2 variants indicated, but some colonies failed to grow (indicated by a blank space in the table). Retentions for samples isolated from transformants grown solely in liquid media were assayed from the same samples shown in Fig. 2C, but were assayed and normalized to an oligonucleotide control in parallel with the plated transformant samples to facilitate comparisons in retention. See Materials and Methods for additional details regarding UBP retention normalization. For samples with near-zero shift, we cannot determine whether the UBP was completely lost in vivo or if the sample came from a colony that was transformed with a fully natural plasmid (some of which arises during plasmid assembly, specifically during the PCR used to generate the UBP-containing insert).
Fig. 3.
Fig. 3.
Cas9-based editing system. (A) Model for Cas9-mediated immunity to UBP loss. (B) UBP retention for pUCX2 TK1 is enhanced by targeting Cas9 cleavage to plasmids that have lost the UBP. The bars labeled hEGFP correspond to UBP retention with growth (black) and regrowth (gray) with an sgRNA that has a sequence taken from the hEGFP gene and thus does not target DNA containing the TK1 sequence (negative control). The bars labeled TK1-A or TK1-A/∆ correspond, respectively, to growth and regrowth with an sgRNA that targets the dNaM to dT mutation or two sgRNAs that individually target the dNaM to dT mutation and a single nucleotide deletion of the UBP.
Fig. S4.
Fig. S4.
Effect of dNaM-dTPT3 on Cas9-mediated cleavage of DNA in vitro. Cas9-mediated in vitro cleavage was assessed for six DNA substrates, wherein the third nucleotide upstream of the PAM is one of the four natural nucleotides, dTPT3, or dNaM. The four sgRNAs that are complementary to each natural template were prepared by in vitro transcription with T7 RNAP. To account for differences in sgRNA activity and/or minor variations in preparation, a relative percent maximal cleavage for each sgRNA vs. all six DNA substrates is shown in parentheses (SI Materials and Methods). Values represent means ±1 SD (n = 3 technical replicates). In several cases, the presence of an unnatural nucleotide significantly reduced cleavage compared with DNA complementary to the sgRNA. These data suggest that Cas9 programmed with sgRNA(s) complementary to one or more of the natural sequences would preferentially cut DNA that had lost the UBP.
Fig. S5.
Fig. S5.
(A) The sgRNA sequences used to enhance retention of the UBP in Fig. 3B (red denotes guide RNA nucleotides mismatched with the DNA target; the position of dTPT3 is denoted by Y and shown in green); hEGFP is a nontarget sgRNA. (B) Sanger sequencing chromatogram illustrating mutation of dNaM to dT in the absence of an sgRNA to target Cas9 nuclease activity. (C) Sanger sequencing chromatogram illustrating that, in the presence of Cas9 and a targeting sgRNA (TK1-A), sequences containing the dNaM to dT mutation are likely depleted by Cas9 cleavage, thus resulting in the accumulation of other mutations that are either not targeted by the TK1-A sgRNA (∆, a single nucleotide deletion of dNaM) or targeted by the TK1-A sgRNA, but less efficiently because of a mismatch between the guide and the mutation sequence (dNaM to dG). UBP-containing species were depleted before sequencing (SI Materials and Methods). The position of the mutation in the chromatograms shown in B and C is indicated by an arrow.
Fig. 4.
Fig. 4.
Variation in Cas9-mediated immunity with sequence context. (A) UBP retentions of pUCX2 variants in strain YZ2 with a pCas9 plasmid that expresses a nontarget sgRNA (gray) or an on-target sgRNA (black). Error bars represent SD of the mean, and n = 3 transformations for all sequences except on-target CXA and CXG, where n = 5. (B) UBP retentions of pAIO plasmids in strain YZ3 (gray), which does not express Cas9, or in strain YZ4 (black) with expression of Cas9. In A and B, the nucleotides immediately flanking X = dNaM are indicated, as is distance to the PAM. “(N)” denotes the nucleotide N in the sgRNA that targets a substitution mutation of the UBP; all pCas9 and pAIO plasmids also express an sgRNA that targets a single nucleotide deletion of the UBP. Error bars represent SD of the mean, and n ≥ 3 colonies; Table S1 for exact values of n, sequences, and IPTG concentrations used to induced Cas9 in YZ4. Materials and Methods for additional experimental details.
Fig. 5.
Fig. 5.
Simultaneous retention of two UBPs during extended growth. Strains YZ3 and YZ4 were transformed with pAIO2X and plated on solid media containing dNaMTP and dTPT3TP, with or without IPTG to induce Cas9. Single colonies were inoculated into liquid media of the same composition, and cultures were grown to an OD600 of ∼2 (point 1). Cultures were subsequently diluted 30,000-fold and regrown to an OD600 of ∼2 (point 2), and this dilution−regrowth process was then repeated two more times (points 3 and 4). As a no-immunity control, strain YZ3 was grown in the absence of IPTG, and two representative cultures are indicated in gray. Strain YZ4 was grown in the presence of varying amounts of IPTG, and averages of cultures are indicated in green (0 µM, n = 5), blue (20 µM, n = 5), and orange (40 µM, n = 4). Retentions of the UBP in gfp and serT are indicated with solid or dotted lines, respectively. After the fourth outgrowth, two of the YZ4 cultures grown with 20 µM IPTG were subcultured on solid media of the same composition. Three randomly selected colonies from each plate (n = 6 total) were inoculated into liquid media of the same composition, and each of the six cultures was grown to an OD600 of ∼1 (point 5), diluted 300,000-fold into media containing 0, 20, and 40 µM IPTG, and regrown to an OD600 of ∼1 (point 6). This dilution−regrowth process was subsequently repeated (point 7). The pAIO2X plasmids were isolated at each of the numbered points and analyzed for UBP retention (Fig. S6). Cell doublings are estimated from OD600 (Materials and Methods) and did not account for growth on solid media, thus making them an underestimate of actual cell doublings. Error bars represent SD of the mean.
Fig. S6.
Fig. S6.
Representative biotin shift assay gels for Fig. 5. Each lane (excluding the oligonucleotide controls) corresponds to a pAIO2X plasmid sample isolated from a clonally derived YZ4 culture, grown with the IPTG concentration indicated, after an estimated 108 cell doublings in liquid culture (point 7 of Fig. 5). Each plasmid sample is split and analyzed in parallel biotin shift reactions that assay the UBP content at the gfp and serT loci (red and blue primers, respectively).
Fig. S7.
Fig. S7.
Representative growth curves of YZ4 replicating pAIO2X. Growth curves are for the first dilution−regrowth (point 2) in Fig. 5. Curves terminate at the OD600 at which cultures were collected for both plasmid isolation and dilution for the next regrowth. Doubling times are calculated from the timepoints collected between OD600 0.1 and 1.0 for each curve and averaged for each strain and/or IPTG condition.

Comment in

References

    1. Malyshev DA, Romesberg FE. The expanded genetic alphabet. Angew Chem Int Ed Engl. 2015;54(41):11930–11944. - PMC - PubMed
    1. Zhang L, et al. Evolution of functional six-nucleotide DNA. J Am Chem Soc. 2015;137(21):6734–6737. - PMC - PubMed
    1. Kimoto M, Hirao I. 2014. Creation of unnatural base pair systems toward new DNA/RNA biotechnologies. Chemical Biology of Nucleic Acids: Fundamentals and Clinical Applications, eds Erdmann AV, Markiewicz TW, Barciszewski J (Springer, Berlin), pp 131–148.
    1. Leduc S. The Mechanisms of Life. Rebman; New York: 1911.
    1. Leconte AM, et al. Discovery, characterization, and optimization of an unnatural base pair for expansion of the genetic alphabet. J Am Chem Soc. 2008;130(7):2336–2343. - PMC - PubMed

Publication types

Substances