. 2017 Jan 18;3(1):e1601503.
doi: 10.1126/sciadv.1601503. eCollection 2017 Jan.

Rainfall regimes of the Green Sahara

Affiliations

Rainfall regimes of the Green Sahara

Jessica E Tierney et al. Sci Adv. .

Abstract

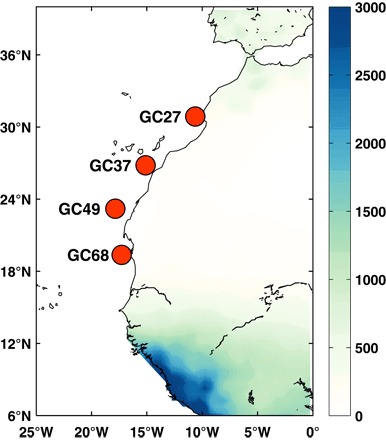
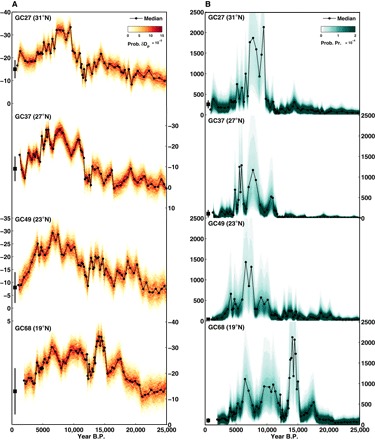
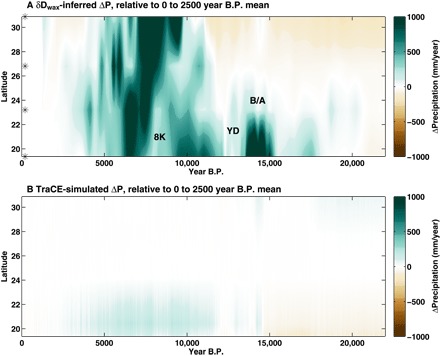
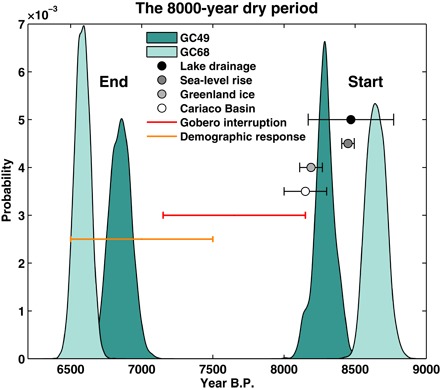
During the "Green Sahara" period (11,000 to 5000 years before the present), the Sahara desert received high amounts of rainfall, supporting diverse vegetation, permanent lakes, and human populations. Our knowledge of rainfall rates and the spatiotemporal extent of wet conditions has suffered from a lack of continuous sedimentary records. We present a quantitative reconstruction of western Saharan precipitation derived from leaf wax isotopes in marine sediments. Our data indicate that the Green Sahara extended to 31°N and likely ended abruptly. We find evidence for a prolonged "pause" in Green Sahara conditions 8000 years ago, coincident with a temporary abandonment of occupational sites by Neolithic humans. The rainfall rates inferred from our data are best explained by strong vegetation and dust feedbacks; without these mechanisms, climate models systematically fail to reproduce the Green Sahara. This study suggests that accurate simulations of future climate change in the Sahara and Sahel will require improvements in our ability to simulate vegetation and dust feedbacks.

Keywords: Climate Change; Climate Modeling; Green Sahara; Hydrogen Isotopes; Leaf Waxes; Paleoclimate.


Figures

Fig. 1
Fig. 1. Location of the sediment cores used in this study and modern mean annual precipitation rates (in millimeters per year) (60).
These cores were collected as part of the Changing Holocene Environments Eastern Tropical Atlantic (CHEETA) R/V Oceanus cruise (OCE437-7) in 2007. Site GC27: 30.88°N, 10.63°W, 1258-m water depth; GC37: 26.816°N, 15.118°W, 2771-m water depth; GC49: 23.206°N, 17.854°W, 2303-m water depth; GC68: 19.363°N, 17.282°W, 1396-m water depth.
Fig. 2
Fig. 2. δDwax-­inferred δDP (A) and mean annual precipitation (in millimeters per year) (B) at each core site.
Black lines indicate median values; colors indicate posterior probability distributions. Black squares with error bars denote modern mean annual observational values and SDs [from the Online Isotopes in Precipitation Calculator (61) for δDP and Global Precipitation Climatology Centre version 6 (60) for precipitation]. Note that, because our δDwax precipitation regression is logarithmic, the uncertainty of our inferred precipitation rates increases at higher precipitation amounts; thus, probability densities are more broadly distributed during wet intervals.
Fig. 3
Fig. 3. Hovmöller diagrams of proxy-inferred and model-simulated precipitation in western Sahara.
(A) δDwax-inferred mean annual precipitation. Asterisks denote the latitudinal locations of the core sites. (B) Mean annual precipitation from the TraCE experiment, conducted with the CCSM3 climate model (44). B/A, Bølling/Allerød period; YD, Younger Dryas; 8K, 8 ka “pause.”
Fig. 4
Fig. 4. The 8 ka pause in Green Sahara conditions.
Green areas denote the probability distributions of the start and end of the 8 ka dry period at sites GC49 (23°N) and GC68 (19°N), on the basis of the inferred locations in the core (from bioturbation modeling) for an abrupt beginning and end, and Monte Carlo iteration of age model uncertainties. Black and gray dots with error bars represent the mean and 1σ ages for climatic events associated with the 8.2 cooling event in the Northern Hemisphere, including (i) the timing of the drainage of Lake Agassiz and Lake Ojibway (37); (ii) the timing of an abrupt rise in sea level, detected in the Netherlands (62); (iii) the duration of the 8.2 event in the Greenland ice cores (38); and (iv) the duration of the response in Cariaco Basin grayscale data (63). Shown in red is the timing and duration of a prolonged interruption in the occupation of the Gobero site by humans (31). The yellow bar indicates a Sahara-wide demographic decline (32).
Fig. 5
Fig. 5. Comparison between paleoclimate data and model simulations of mid-Holocene (6 ka) climate in the western Sahara.
Model data represent 6 ka anomalies (relative to preindustrial control simulations) for land grid cells closest to the Atlantic coast along the given latitudes (y axis). Asterisks next to the model names (x axis) denote models with a dynamic vegetation module. PMIP2 and PMIP3 indicate models participating in the Paleoclimate Intercomparison Project Phase 2 and 3, respectively. The EC-Earth simulations are from the study by Pausata et al. (27). The data shown include both pollen-inferred precipitation data (16) and leaf wax–inferred precipitation data (this study). To overcome the paucity of data in the western Sahara, the pollen data represent average values across the entirety of North Africa for the given latitudes. X denotes no data available for the given latitude.

Similar articles

Cited by

References

    1. Gasse F., Hydrological changes in the African tropics since the Last Glacial Maximum. Quat. Sci. Rev. 19, 189–211 (2000).
    1. Hoelzmann P., Keding B., Berke H., Kröpelin S., Kruse H.-J., Environmental change and archaeology: Lake evolution and human occupation in the Eastern Sahara during the Holocene. Palaeogeogr. Palaeoclimatol. Palaeoecol. 169, 193–217 (2001).
    1. Kuper R., Kröpelin S., Climate-controlled Holocene occupation in the Sahara: Motor of Africa’s evolution. Science 313, 803–807 (2006). - PubMed
    1. deMenocal P. B., Plio-Pleistocene African climate. Science 270, 53–59 (1995). - PubMed
    1. Kutzbach J. E., Monsoon climate of the early Holocene: Climate experiment with the Earth’s orbital parameters for 9000 years ago. Science 214, 59–61 (1981). - PubMed

LinkOut - more resources