. 2017 Feb;46(Suppl 1):119-131.
doi: 10.1007/s13280-016-0873-7.

Climate change stimulates the growth of the intertidal macroalgae Ascophyllum nodosum near the northern distribution limit

Affiliations

Climate change stimulates the growth of the intertidal macroalgae Ascophyllum nodosum near the northern distribution limit

Núria Marbà et al. Ambio. 2017 Feb.

Abstract

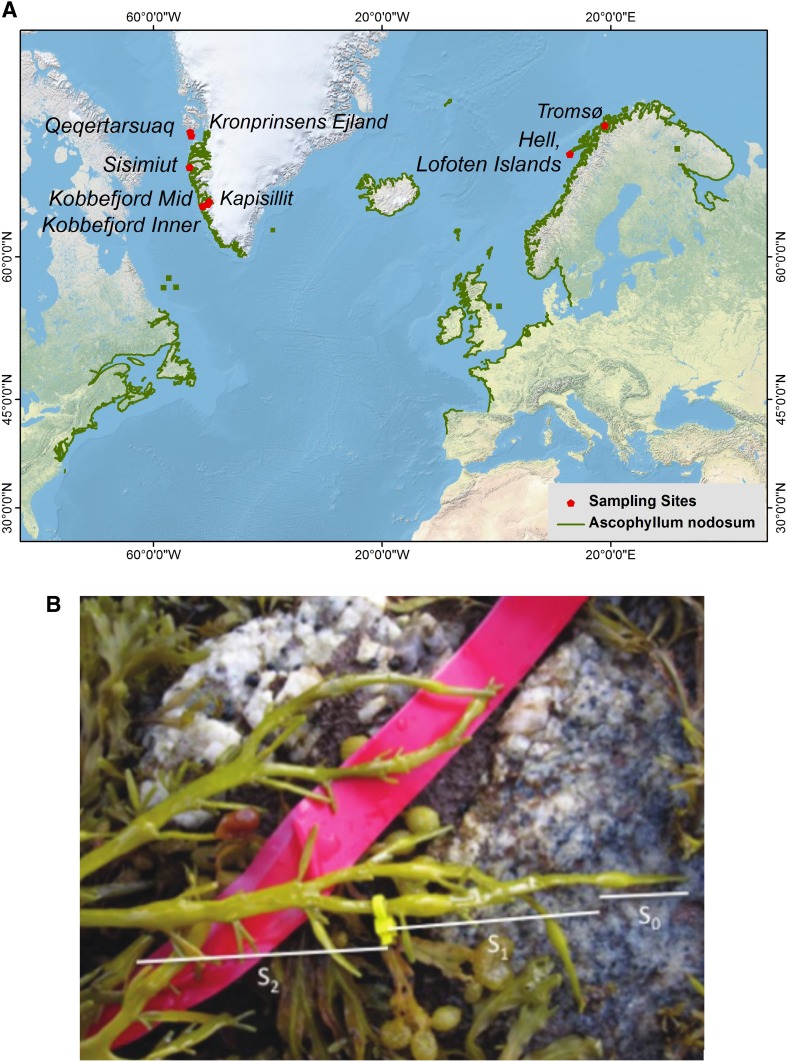
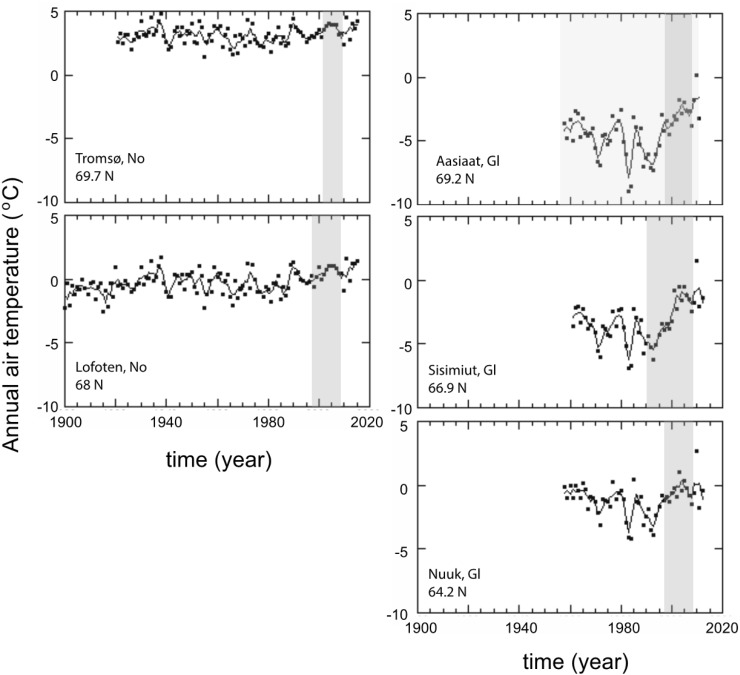
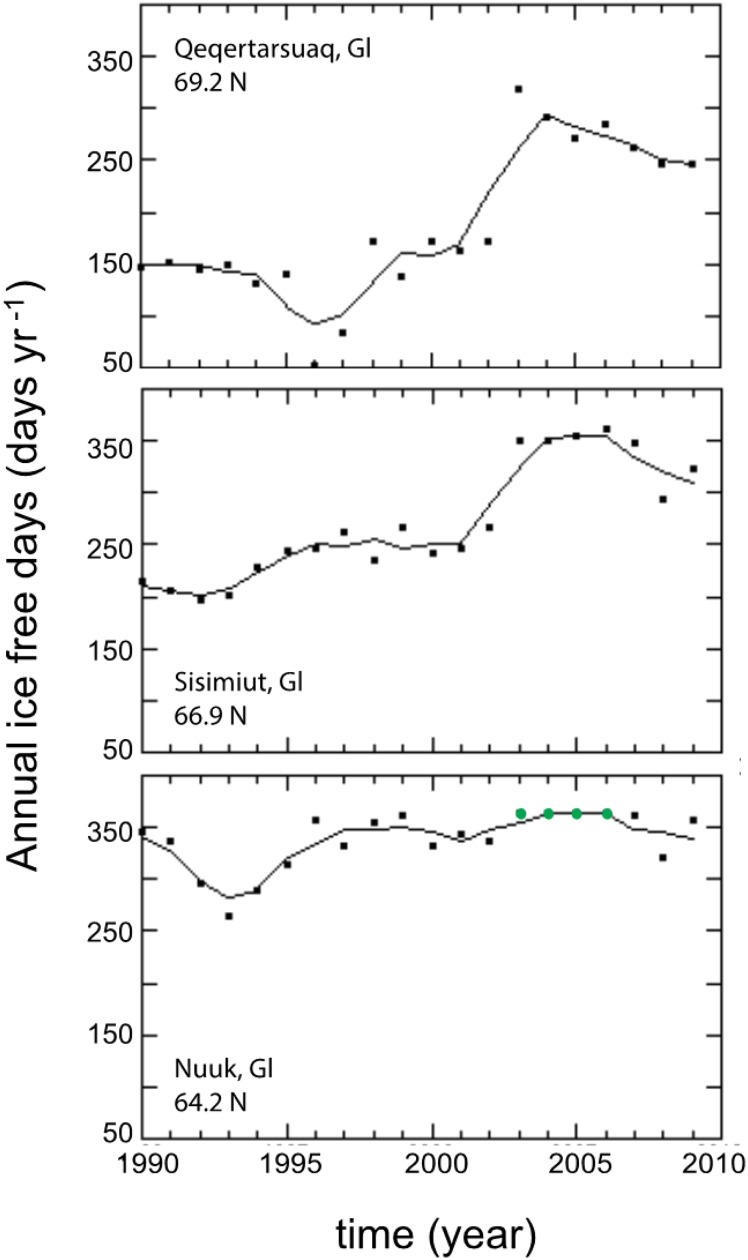
Ascophyllum nodosum is a foundation macroalgae of the intertidal zone that distributes across latitude 41.3-69.7°N. We tested the hypothesis that growth of A. nodosum near the northern distribution edge increases with warming. We retrospectively quantified the growth of eight A. nodosum populations at West Greenland and North Norway (from 64°N to 69°N). For seven populations, we measured growth rates since 1997-2002 and for one of them we extended the time series back to 1956 using published estimates. Individuals at northern populations elongated between 2.0 and 9.1 cm year-1 and this variability correlated with temperature and annual ice-free days. A spatial comparison of A. nodosum growth across the species distribution range showed that Northern (and coldest) populations grew at the slowest rates. Our results demonstrate that arctic climate change enhances the growth of A. nodosum populations and suggest that their productivity may increase in response to projected global warming.

Keywords: Elongation; Greenland; Latitude gradient; Norway; Warming.


Figures

Fig. 1
Fig. 1
a Location of study sites. b Ascophyllum nodosum tip showing the three youngest internodes: S 0 (produced the current year), S 1 (produced the previous year), S 2 (produced 2 years earlier). The yellow marking was used to test the assumption that a new bladder is produced every year: the production of a new bladder apparently displaced the yellow mark from its original the position between the youngest and the second youngest bladder to the position between the second and third youngest within 1 year
Fig. 2
Fig. 2
Time series of annual air temperature recorded at meteorological stations close to each study site. The dots and the solid lines show temperature observations and running mean of 3 year, respectively. Sources of data: http://www.dmi.dk/laer-om/generelt/dmi-publikationer/2013/ for Greenland (Gl), http://www.yr.no/place/Norway/Troms/Troms%C3%B8/Troms%C3%B8_observation_site/climate.month01.html for Tromsø and http://www.yr.no/place/Norway/Nordland/Flakstad/Lofoten/climate.html#year for Lofoten observations. Grey background indicates the time period of available A. nodosum growth data in the area. For Aasiaat, A. nodosum growth was measured at two stations and both time periods of growth measurements are indicated (Qeqertarsuaq: dark grey; Kronprinsens: light grey)
Fig. 3
Fig. 3
Time series of annual sea ice-free days at Greenland study sites obtained from satellite images. The dots and the solid lines, respectively, show the annual observations and the running mean of 3 year. Green dots indicate years without sea ice cover
Fig. 4
Fig. 4
Time series of Ascophyllum nodosum growth at the studied sub-Arctic and Arctic populations. The dots and the solid lines, respectively, show growth observations and running mean of 3 years. Growth observations at Kronprinsens Ejland in 1957–1958 and 1984–1985 (Wilce ; Hansen et al. 2004) and at Qeqertarsuaq in 1997–1998 (Hansen et al. 2004) are identified by open circles. Growth time series at Kronprinsens Ejland since 1995 is highlighted in the inserted plot
Fig. 5
Fig. 5
Trajectories of temporal changes in Ascophyllum nodosum growth with mean air temperature (a) and annual ice-free days (b). Double circles indicate the beginning of the time series. For all variables, the values correspond to the running mean of 3 years. Open circles indicate the growth estimates obtained from Wilce (1964) and Hansen et al. (2004)
Fig. 6
Fig. 6
Ascophyllum nodosum annual tip elongation versus latitude. Filled circles indicate the annual elongation rate of seaweed tips of the studied populations. The solid line indicates the equation fitted y = 30.42 (±1.47) − [0.32 (±0.02)·x] − [0.03 (±0.004)·(x − 55.72)2] (n = 172, R 2 = 0.61, p < 0.0001)

References

    1. Åberg P. Size-based demography of the seaweed Ascophyllum nodosum in stochastic environments. Ecology. 1992;73:1488–1501. doi: 10.2307/1940692. - DOI
    1. Araújo RM, Serrao EA, Sousa-Pinto I, Åberg P. Spatial and temporal dynamics of Fucoid populations (Ascophyllum nodosum and Fucus serratus): A comparison between central and range edge populations. PLoS ONE. 2014;9:e92177. doi: 10.1371/journal.pone.0092177. - DOI - PMC - PubMed
    1. Bartsch I, Paar M, Fredriksen S, Schwanitz M, Daniel C, Hop H, Wiencke C. Changes in kelp forest biomass and depth distribution in Kongsfjorden, Svalbard, between 1996–1998 and 2012–2014 reflect Arctic warming. Polar Biology. 2016
    1. Beuchel F, Gulliksen B, Carroll ML. Long-term patterns of rocky bottom macrobenthic community structure in an Arctic fjord (Kongsfjorden, Svalbard) in relation to climate variability (1980–2003) Journal of Marine Systems. 2006;63:35–48. doi: 10.1016/j.jmarsys.2006.05.002. - DOI
    1. Burrows MT, Schoeman DS, Buckley LB, Moore P, Poloczanska ES, Brander KM, Brander KM, Brown C, et al. The pace of shifting climate in marine and terrestrial ecosystems. Science. 2011;334:652–655. doi: 10.1126/science.1210288. - DOI - PubMed

LinkOut - more resources