

Review
doi: 10.1038/ncomms14271.
Accelerating the search for the missing proteins in the human proteome
Affiliations
- PMID: 28117396
- PMCID: PMC5286205
- DOI: 10.1038/ncomms14271
Item in Clipboard
Review
Accelerating the search for the missing proteins in the human proteome
Nat Commun.
.
Abstract
The Human Proteome Project (HPP) aims to discover high-stringency data for all proteins encoded by the human genome. Currently, ∼18% of the proteins in the human proteome (the missing proteins) do not have high-stringency evidence (for example, mass spectrometry) confirming their existence, while much additional information is available about many of these missing proteins. Here, we present MissingProteinPedia as a community resource to accelerate the discovery and understanding of these missing proteins.
Conflict of interest statement
The authors declare no competing financial interests.
Figures
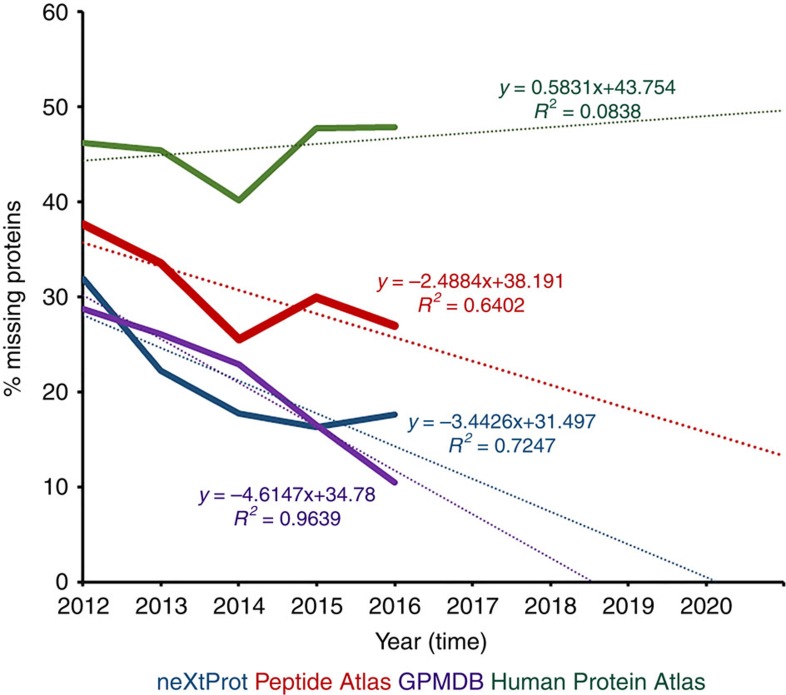
Data required for this analysis (2012→2014) was extracted from Omenn et al. , with additional (2015 and 2016) statistics obtained from neXtProt, Peptide Atlas and GPMDB. Note: GPMDB data are not currently captured by neXtProt as part of the data input into the HPP (see Box 2), but GPMDB plays a role in defining annual HPP metrics.
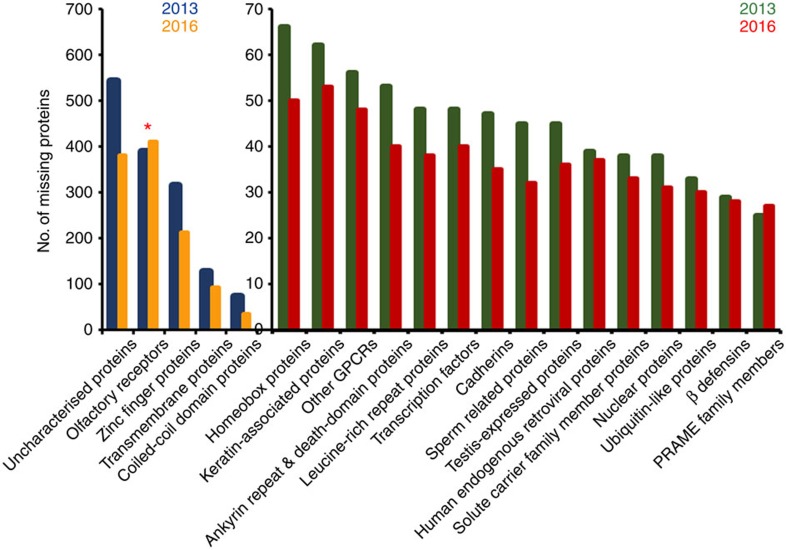
According to these data, olfactory receptors (ORs; marked with a red asterisk *) represent the largest family of PE2-4 proteins. The olfactory receptors also show the largest increase between 2013 and 2016 (that is, 15% in 2016 from 10% in 2013) when compared to the other families. The scale ‘0–70' represents a magnified axis scale for protein descriptors having <70 missing proteins. Blue and green colours represent PE2-4 proteins from 2013 whereas orange and red colours represent 2016 missing proteins.
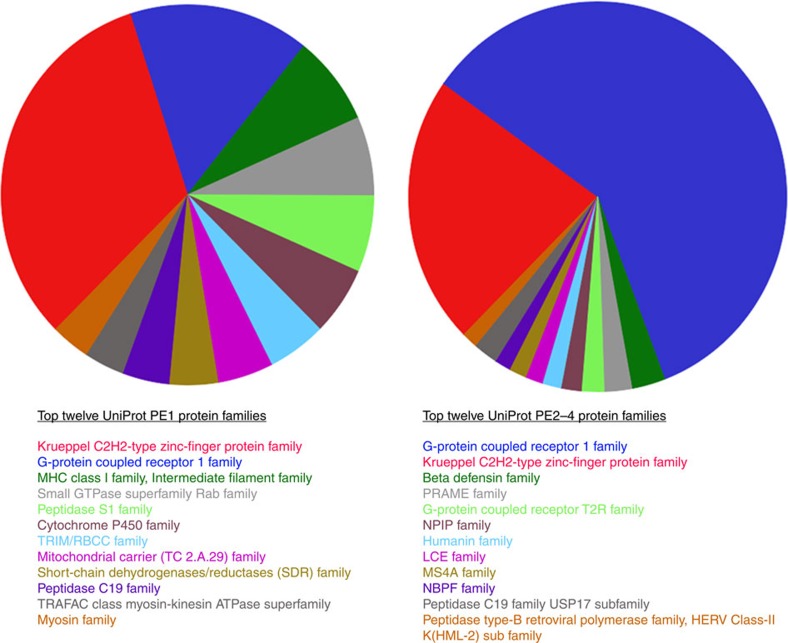
The most represented PE1 families (left hand side) are the Krueppel zinc-finger protein family followed by the G-protein coupled receptor 1 family. These two families are also at the top of the PE2-4 category (right hand side) with the order reversed.
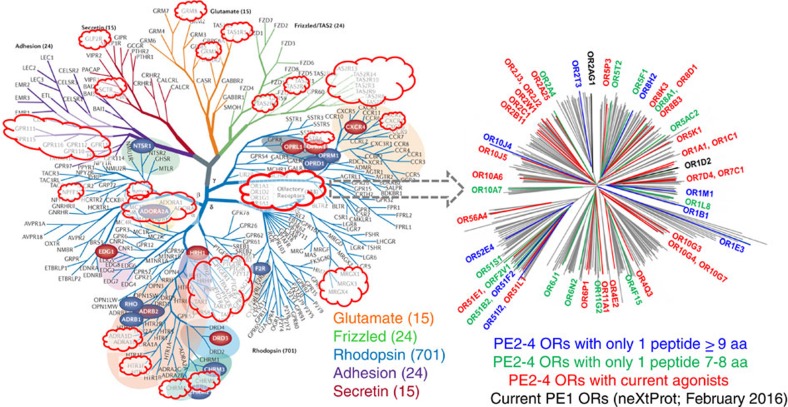
In this composite figure, GPCR (left) family branches (largest ‘receptor' subset of all human and the PE2-4 proteins) are shown in an unrooted phylogenetic tree from Panther analyses with PE2-4 GPCRs highlighted inside red clouds, and an unrooted GCPR subset phylogenetic tree showing olfactory receptors (right) was produced using iTOP, from neXtProt February 2016 PE1 olfactory receptors or best available, manually validated proteotypic MS evidence for olfactory receptor was retrieved. olfactory receptors with functional activity (known agonists) are shown in red in the left figure, as from Mainland et al.. GPCR figure modified with permission from Macmillan Publishers Ltd: Nature Reviews. Drug Discovery, Stevens et al. copyright 2013.
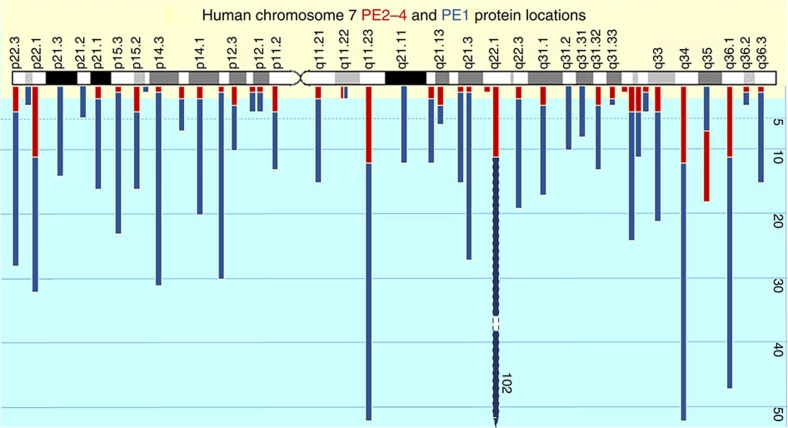
The data show random distribution of both along the complete length of human Chr 7. However, Giemsa banding patterns of light (GC-rich) and dark (GC-poor) bands are shown that debatably correspond to regions of gene density from light (higher gene density) to dark (lower gene density).
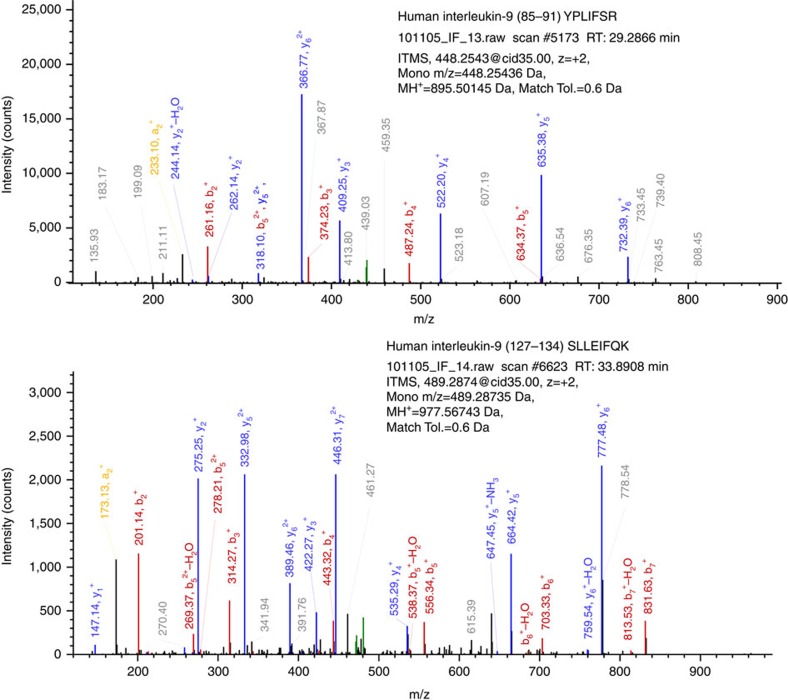
Although not yet observed in any publicly available MS databases, both of these peptides are predicted to be proteotypic by neXtProt Unicity checker ( https://search.nextprot.org/viewers/unicity-checker/app/index.html ).
References
-
- Paik Y. K. et al.. The Chromosome-centric Human Proteome Project for cataloging proteins encoded in the genome. Nat. Biotechnol. 30, 221–223 (2012) Aims to define full set of human proteins encoded by ∼20,300 genes, chromosome-by-chromosome including tissue localization, isoforms and PTMs using MS and Abs. First coined term ‘missing proteins'. - PubMed
-
- Paik Y. K. et al.. Standard guidelines for the Chromosome-centric Human Proteome Project. J. Proteome Res. 11, 2005–2013 (2012). - PubMed
-
- Omenn G. S. et al.. Metrics for the Human Proteome Project 2016: progress on identifying and characterizing the human proteome, including post-translational modifications. J. Proteome Res. 15, 3951–3960 (2016) Update on HPP annual communal data re-analyses that adopted higher stringency MS metrics for protein evidence (PE1 = two unitypic peptides > 9 residues). HPP (neXtProt version 2016-02) has 16,518 PE1 proteins, with 2,949 PE2-4 missing proteins and 485 reclassified by higher stringency HPP Guidelines v2.0 to reduce false positives. - PMC - PubMed
Publication types
MeSH terms
Substances
LinkOut - more resources
Full Text Sources
Other Literature Sources
Molecular Biology Databases
