. 2017 Jan 24:8:14061.
doi: 10.1038/ncomms14061.

Transient structural variations have strong effects on quantitative traits and reproductive isolation in fission yeast

Affiliations

Transient structural variations have strong effects on quantitative traits and reproductive isolation in fission yeast

Daniel C Jeffares et al. Nat Commun. .

Abstract

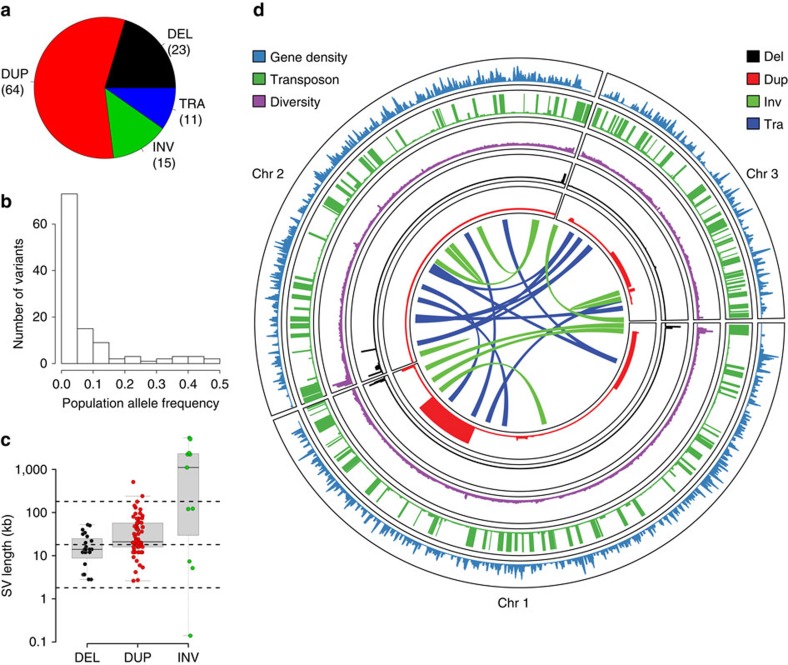
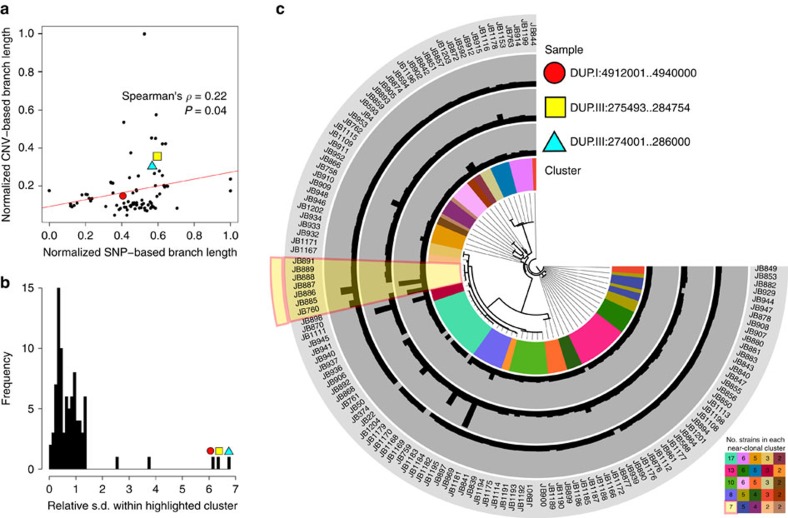
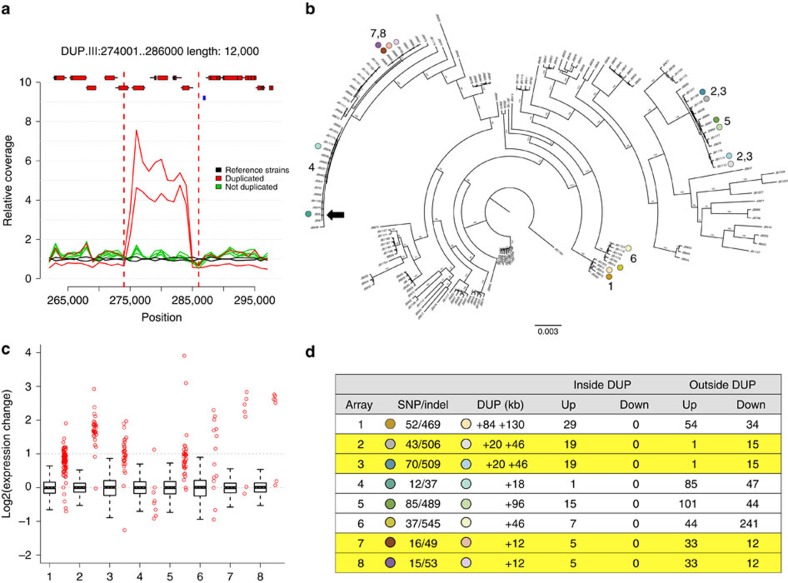
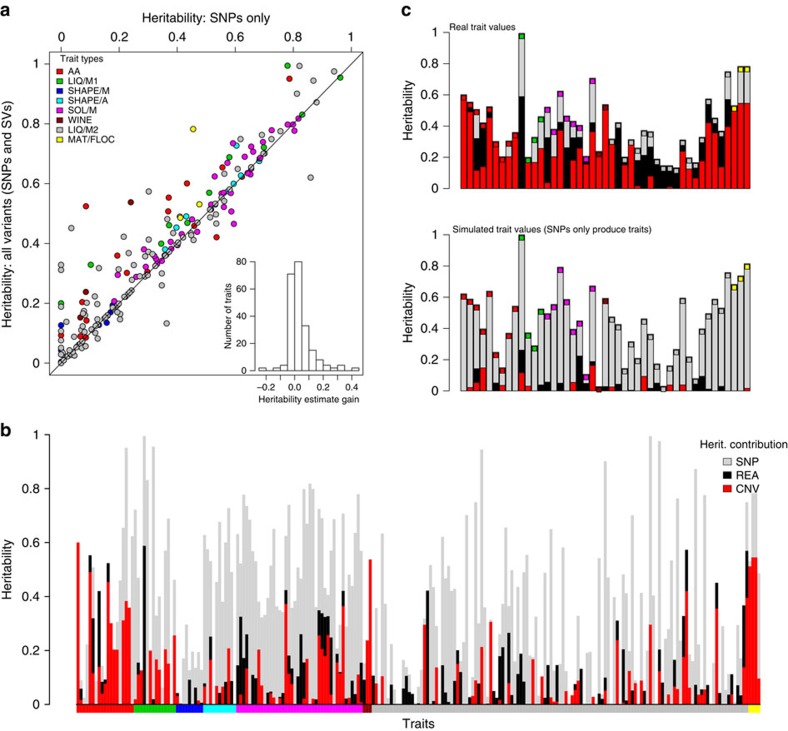
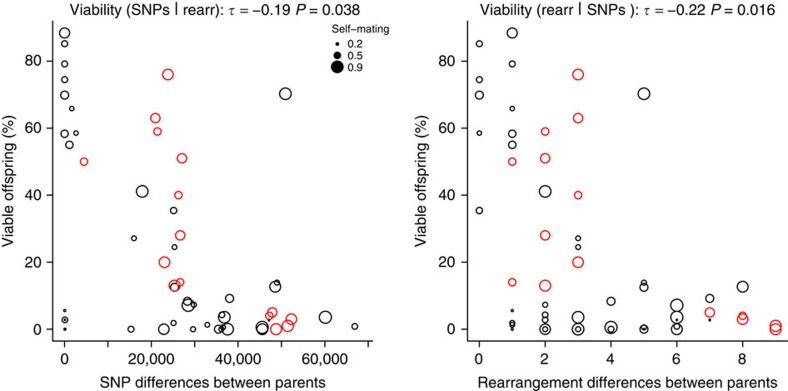
Large structural variations (SVs) within genomes are more challenging to identify than smaller genetic variants but may substantially contribute to phenotypic diversity and evolution. We analyse the effects of SVs on gene expression, quantitative traits and intrinsic reproductive isolation in the yeast Schizosaccharomyces pombe. We establish a high-quality curated catalogue of SVs in the genomes of a worldwide library of S. pombe strains, including duplications, deletions, inversions and translocations. We show that copy number variants (CNVs) show a variety of genetic signals consistent with rapid turnover. These transient CNVs produce stoichiometric effects on gene expression both within and outside the duplicated regions. CNVs make substantial contributions to quantitative traits, most notably intracellular amino acid concentrations, growth under stress and sugar utilization in winemaking, whereas rearrangements are strongly associated with reproductive isolation. Collectively, these findings have broad implications for evolution and for our understanding of quantitative traits including complex human diseases.


Conflict of interest statement

The authors declare no competing financial interests.

Figures

Figure 1
Figure 1. Characteristics of SVs in S. pombe.
(a) Relative proportions of SVs identified. Duplications (DUP) were the most abundant SVs, followed by deletions (DEL), inversions (INV) and translocations (TRA). (b) Population allele frequency distribution of SVs, showing the frequencies of less abundant alleles in the population (minor allele frequencies). (c) Length distributions of SVs, log10 scale. Deletions were smallest (2.8–52 kb), duplications larger (2.6–510 kb) and inversions often even larger, spanning large portions of chromosomes (0.1 kb–5,374 kb, see d). Horizontal dotted lines show the size of chromosome regions that contain an average of 1, 10 and 100 genes in this yeast. Box plots indicate the first quartile, the median and the third quartile; whiskers extend to the most extreme data point, which is no more than 1.5 × the interquartile range from the box. (d) Locations of SVs on the three chromosomes compared with other genomic features. From outside: density of essential genes, locations of Tf-type retrotransposons, diversity (π, average pairwise diversity from SNPs), deletions (black), duplications (red) and breakpoints of inversions and translocations as curved lines inside the concentric circles (green and blue, respectively). Bar heights for retrotransposons, deletions and duplications are proportional to minor allele frequencies. Diversity and retrotransposon frequencies were calculated from 57 non-clonal strains as described by Jeffares et al.
Figure 2
Figure 2. CNVs are transient within fission yeast.
(a) For each of the 87 CNVs we calculated the genetic distance between strains using SNPs in the region around the CNV (20 kb up- and downstream of the CNV, merged) as the total branch length from an approximate maximum-likelihood tree (x axis, SNP-based branch length normalized to maximum value). We further calculated a CNV-based distance using the total branch length from a neighbour-joining tree constructed from Euclidean distances between strains based on their copy numbers (y axis, CNV-based branch length normalized to maximum value). The weak correlation indicates that CNVs are subject to additional or different evolutionary processes. (b) Histogram of the standard deviation of each CNV within a near-clonal cluster (see also Fig. 2a), relative to its standard deviation across strains not in the near-clonal cluster. Standard deviation is highly correlated with CNV-based branch length (Spearman rank correlation ρ=0.90, P<0.001) (Supplementary Fig. 4b). The highlighted CNVs have unusually high rates of variation within this cluster compared with other clusters. (c) Copy number variation of these highlighted CNVs plotted on a SNP-based phylogeny (20 kb up- and downstream of the DUP.III:274001..286000 CNV) shows their relative transience within the cluster, as well as their variation across other near-clonal clusters. SNP-based phylogenies for the other two selected CNVs also do not separate the strains with different copy numbers (individual plots for each CNV across clusters for its corresponding SNP-based phylogeny are available as Supplementary data).
Figure 3
Figure 3. Transient duplications affect gene expression.
(a) Duplications occur within near-clonal strains. Plot showing average read coverage in 1 kb windows for two clonal strains (JB760, JB886) with the duplication (red), five strains without duplication (green) and two reference strains (h+, and h−) (black). Genes (with exons as red rectangles) and retrotransposon LTRs (blue rectangles) are shown on top (see Supplementary Table 3 for details). (b) Eight pairs of closely related strains, differing by one or more large duplications, selected for expression analysis. The tree indicates the relatedness of these strain pairs (dots coloured as in d). The position of the reference strain (Leupold’s 972, JB22) is indicated with a black arrow. The scale bar shows the length of 0.003 insertions per site. (c) Gene expression increases for most genes within duplicated regions. For each tested strain pair, we show the relative gene expression (strains with duplication/strains without duplication) for all genes outside the duplication (as boxplot) and for all genes within the duplication (red strip chart). In all but one case (array 4), the genes within the duplication tend to be more highly expressed than the genes outside of the duplication (all Wilcoxon rank sum test P values <1.5 × 10⁻³). Box plots indicate the first quartile, the median and the third quartile; whiskers extend to the most extreme data point, which is no more than 1.5 × the interquartile range from the box. (d) Summary of expression arrays 1–8, with strains indicated as coloured dots (as in b), showing number of SNP differences between strains, sizes of duplications in kb (DUP, where ‘+X +Y’ indicates two duplications with lengths X and Y, respectively). We show total numbers of induced (up) and repressed (down) genes, both inside and outside the duplicated regions. Arrays 2,3 and 7,8 (in yellow shading) are replicates within the same clonal population that contain the same duplications, so we list the number of up- and downregulated genes that are consistent between both arrays. See Supplementary Tables 3 and 4 for details.
Figure 4
Figure 4. SVs contribute to quantitative traits.
(a) Heritability estimates are improved by the addition of SVs. Heritability estimates for 228 traits (Supplementary Table 5), using only SNP data (x axis) range from 0 to 96% (median 29%). Adding SV calls (y axis) increases the estimates (median 34%), with estimates for some traits being improved up to a gain of 43% (histogram inset). The diagonal line shows where estimates after adding SVs are the same as those without (x=y). Inset: the distribution of the ‘gain’ in heritability after adding SV calls (median 0.4%, maximum 43%). Points are coloured by trait types, according to legend top left. (b) The contributions of SNPs (grey), CNVs (red) and rearrangements (black) to heritability varied considerably between traits. Coloured bars along the x axis indicate the trait types. heritability estimates are in Supplementary Table 5. The panel below bars indicates trait types as in the legend for part (a). (c, top) For some traits, SVs explained more of the trait variation than SNPs. Boxes are coloured as legend in a. (c, lower) Analysis of simulated data generated with assumption that only SNPs cause traits indicates that the contribution of SVs to trait variance is unlikely to be due to linkage. Traits from left are; with red inset at top, free amino acid concentrations (glutamine, histidine, lysine, methionine, phenylalanine, proline and tyrosine), with green inset liquid media growth traits (maximum mass in minimal media, time to maximum slope, most rapid slope and highest cell density in rich media), in with magenta inset colony growth on solid media (with Brefeldin, CuSO4, H2O2, hydroxyurea, 0.0025% MMS, 0.005% MMS, with proline and 0.001% SDS), wine traits with Burgundy inset (malic acid accumulation and glucose+fructose ultilisation), with grey inset liquid media conditions (caffeine lag, rate and efficiency, CsCl12 efficiency, diamide growth rate, EMS growth rate, ethanol efficiency, ethanol growth rate, galactose growth rate, growth rate at 40°C, HqCl2 lag, KCl efficiency, MgCl2 efficiency, MMS lag, NiCl lag, unstressed lag and rate, SrCl efficiency, tunicamycin lag and rate), and with yellow insets mating traits (the proportion of free spores, mating figures observed and total spore counts).
Figure 5
Figure 5. Both SNPs and rearrangements contribute to intrinsic reproductive isolation.
Spore viability was measured from 58 different crosses from Jeffares et al. (black) or Avelar et al. (red), with each circle in the plots representing one cross. An additive linear model incorporating both SNP and rearrangement differences showed highly significant correlations with viability (P=1.2 × 10⁻⁶, r2=0.39). Both genetic distances measured using SNPs and rearrangements (inversions and translocations) significantly correlated with viability when controlling for the other factor (Kendall partial rank order correlations with viability SNPs|rearrangements τ=−0.19, P=0.038; rearrangements|SNPs τ=−0.22, P=0.016). Some strains produce low-viability spores even when self-mated with their own genotype. The lowest self-mating viability of each strain pair is indicated by circle size (see legend, smaller circles indicate lower self-mating viability) to illustrate that low-viability outliers tend to include such cases (see Supplementary Table 8 for details).

References

    1. Chen C. et al.. A comprehensive survey of copy number variation in 18 diverse pig populations and identification of candidate copy number variable genes associated with complex traits. BMC Genomics 13, 733 (2012). - PMC - PubMed
    1. Stefansson H. et al.. CNVs conferring risk of autism or schizophrenia affect cognition in controls. Nature 505, 361–366 (2014). - PubMed
    1. Wang Y. et al.. Copy number variation at the GL7 locus contributes to grain size diversity in rice. Nat. Genet. 47, 944–948 (2015). - PubMed
    1. Zhang F., Gu W., Hurles M. E. & Lupski J. R. Copy number variation in human health, disease, and evolution. Annu. Rev. Genomics Hum. Genet. 10, 451–481 (2009). - PMC - PubMed
    1. Zhang H. et al.. Gene copy-number variation in haploid and diploid strains of the yeast Saccharomyces cerevisiae. Genetics 193, 785–801 (2013). - PMC - PubMed

Publication types

MeSH terms