. 2017 Feb 2;542(7639):101-104.
doi: 10.1038/nature21038. Epub 2017 Jan 25.

Plasmodium malariae and P. ovale genomes provide insights into malaria parasite evolution

Affiliations

Plasmodium malariae and P. ovale genomes provide insights into malaria parasite evolution

Gavin G Rutledge et al. Nature. .

Abstract

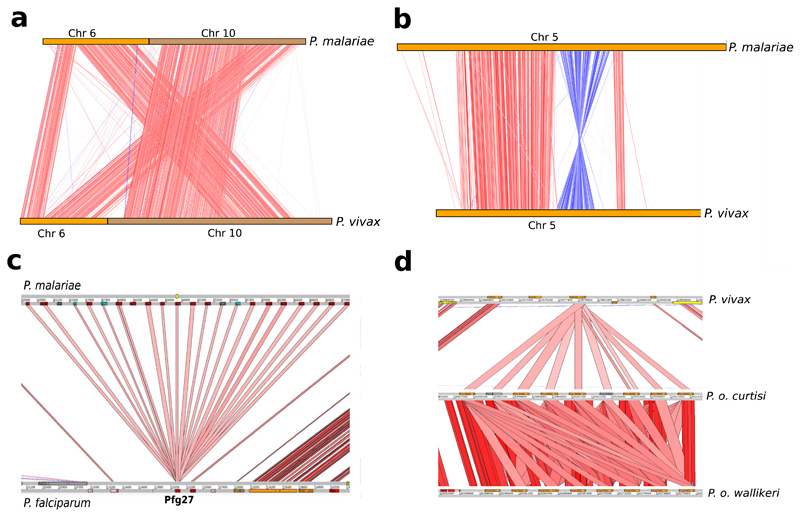
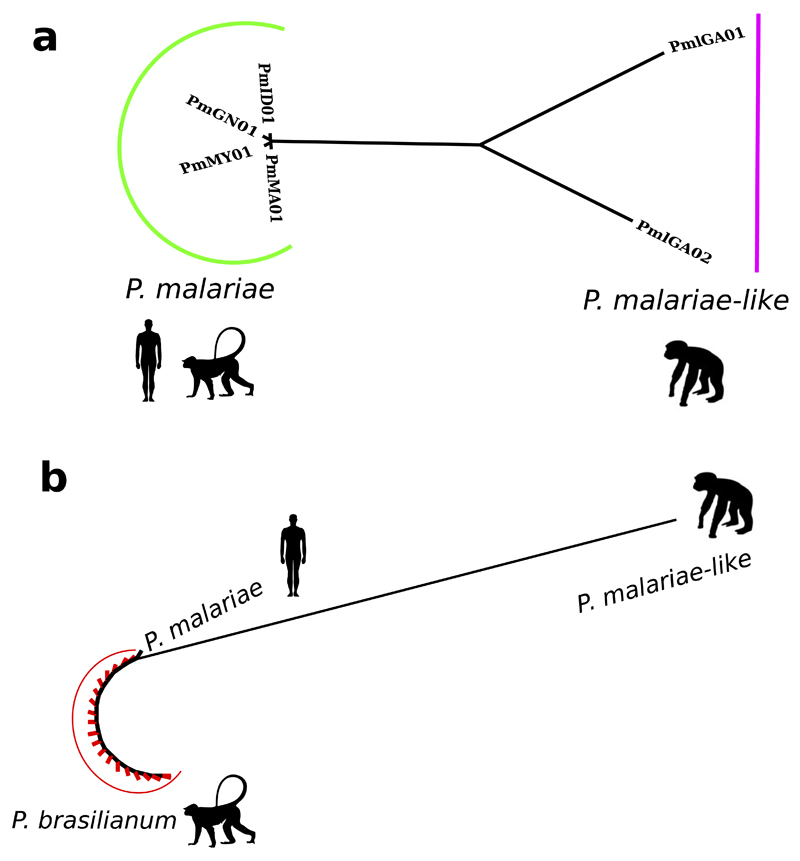
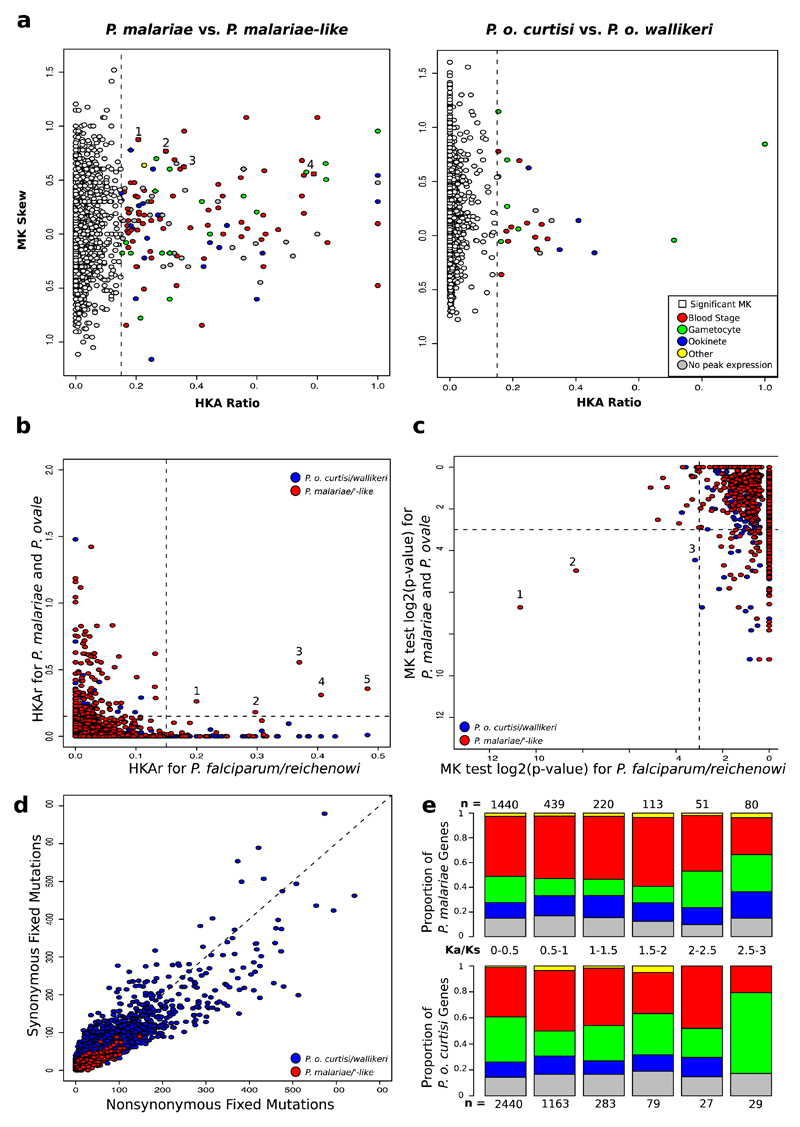
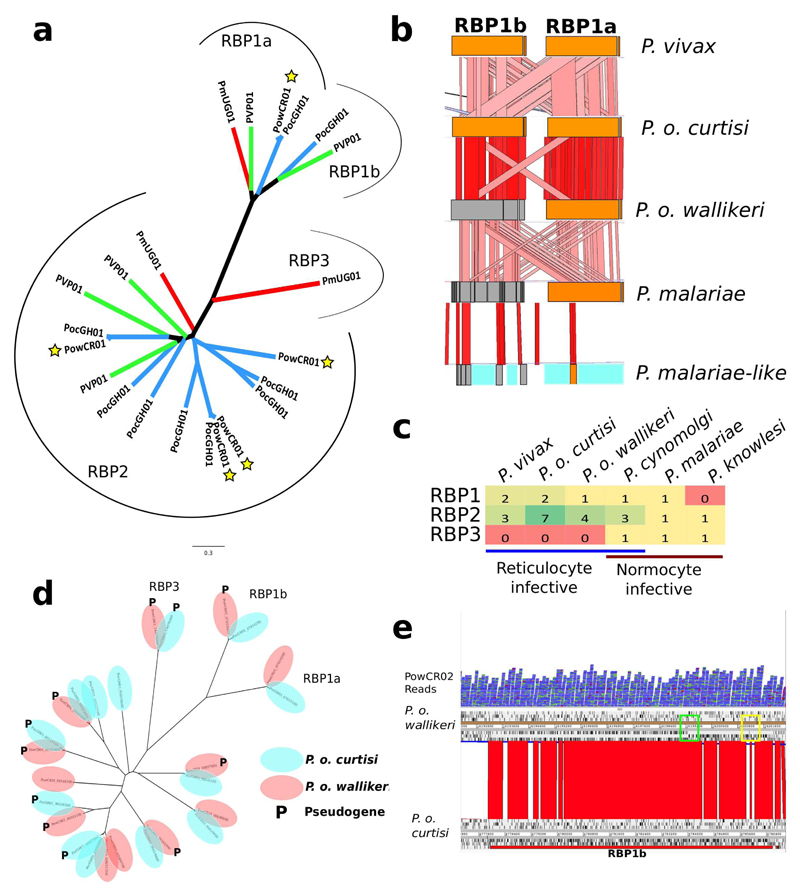
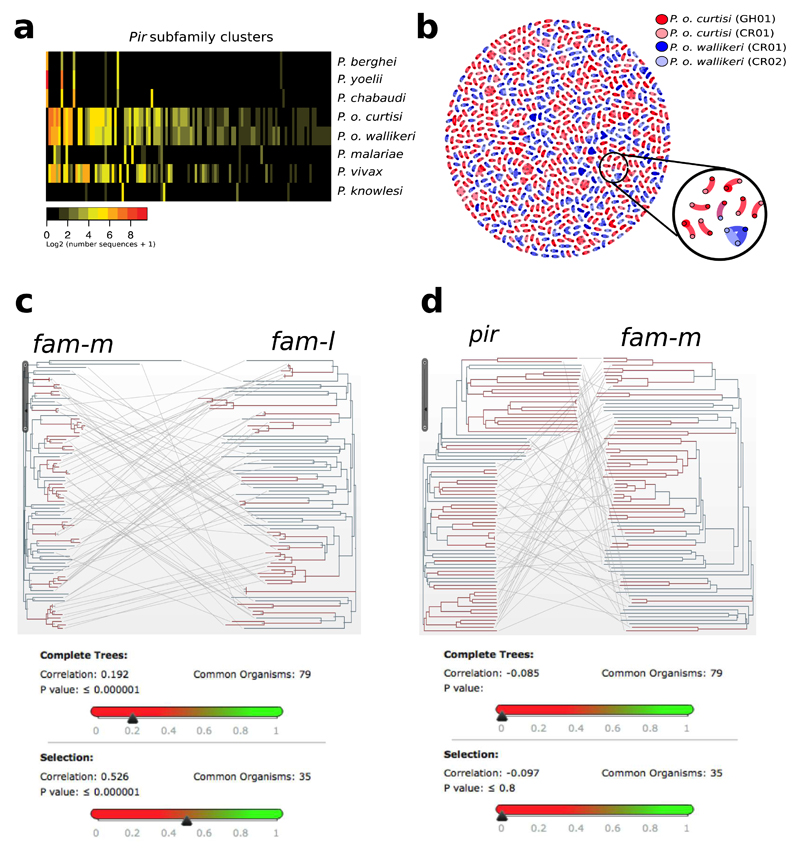
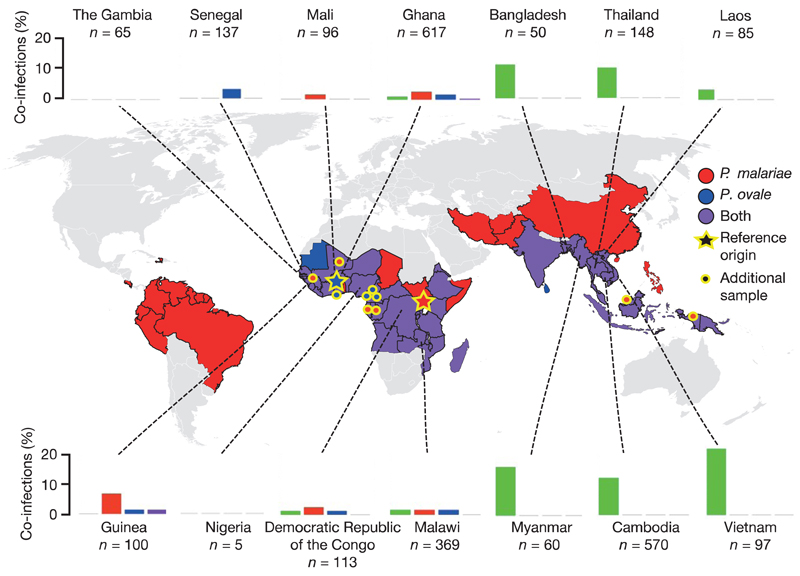
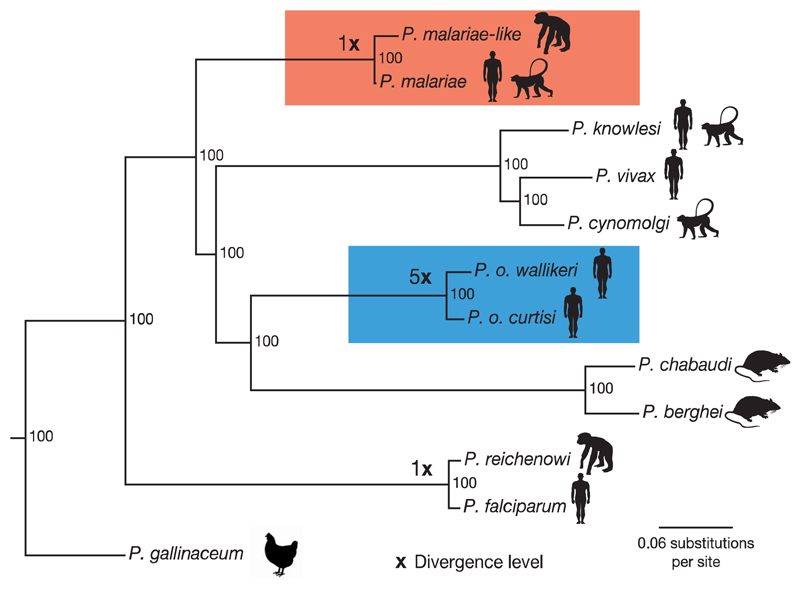
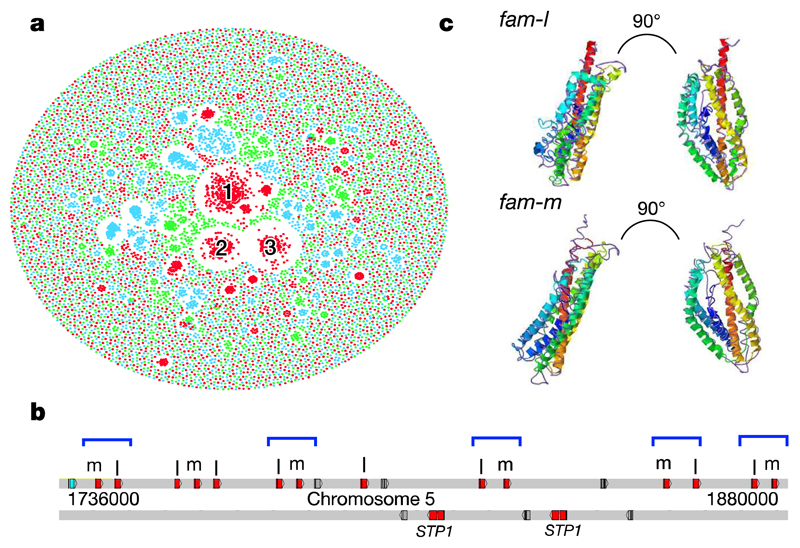
Elucidation of the evolutionary history and interrelatedness of Plasmodium species that infect humans has been hampered by a lack of genetic information for three human-infective species: P. malariae and two P. ovale species (P. o. curtisi and P. o. wallikeri). These species are prevalent across most regions in which malaria is endemic and are often undetectable by light microscopy, rendering their study in human populations difficult. The exact evolutionary relationship of these species to the other human-infective species has been contested. Using a new reference genome for P. malariae and a manually curated draft P. o. curtisi genome, we are now able to accurately place these species within the Plasmodium phylogeny. Sequencing of a P. malariae relative that infects chimpanzees reveals similar signatures of selection in the P. malariae lineage to another Plasmodium lineage shown to be capable of colonization of both human and chimpanzee hosts. Molecular dating suggests that these host adaptations occurred over similar evolutionary timescales. In addition to the core genome that is conserved between species, differences in gene content can be linked to their specific biology. The genome suggests that P. malariae expresses a family of heterodimeric proteins on its surface that have structural similarities to a protein crucial for invasion of red blood cells. The data presented here provide insight into the evolution of the Plasmodium genus as a whole.


Figures

Extended Data Figure 1
Extended Data Figure 1. Large genomic changes in the P. malariae and P. ovale genome sequences.
a, Artemis Comparison Tool (ACT) view showing reciprocal translocation of chromosomes 6 and 10 in P. malariae. The red lines indicate blast similarities, chromosome 6 in orange and chromosome 10 in brown. b, ACT view showing a pericentric inversion in chromosome 5 of P. malariae. Red lines indicate BLAST similarities and blue lines indicate inverted BLAST hits. c, Expansion of 22 copies (20 functional) of Pfg27 in P. malariae (top) compared to a single copy in P. falciparum (bottom) with red lines indicating BLAST similarities. Functional genes are in red and pseudogenes in grey. This compares to only 17 Pfg27 copies described previously, which were found on six separate contigs, while all Pfg27 copies described here are found on the same contig. d, Expansion of PVP01_1270800 (PF3D7_1475900 in P. falciparum), a gene with no known function, in P. o. curtisi and P. o. wallikeri, with different copy numbers in each, compared to the one copy in P. vivax. Functional genes shown in orange and pseudogenes shown in grey. This gene family was recently named KELT, and we confirm the 8 copies present in P. o. wallikeri, but show that P. o. curtisi has 9 copies, two of which are pseudogenes.
Extended Data Figure 2
Extended Data Figure 2. P. malariae-like has significantly longer branch lengths than P. malariae, and P. brasilianum is identical to P. malariae.
a, A phylogenetic tree of all P. malariae and P. malariae-like samples generated using PhyML on the basis of all P. malariae genes. P. malariae samples are indicated by a green bar and P. malariae--like samples are indicated by a purple bar. Silhouettes represent host infectivity. b, A PhyML phylogenetic tree of all P. brasilianum 18S rRNA sequences, indicated by a red bar and red tip branches, and the corresponding 18S rRNA sequences from the P. malariae and P. malariae-like assemblies, labelled as such. Silhouettes represent the host origin for each sample.
Extended Data Figure 3
Extended Data Figure 3. Different population genetics in P. malariae and P. o. curtisi.
a, HKA ratio and MK Skew for both P. malariae versus P. malariae-like (left) and P. o. curtisi versus P. o. wallikeri (right). Genes with high HKAr values (>0.15, vertical line) are coloured by the peak expression of their orthologue in P. falciparum (red, blood stage; green, gametocyte; blue, ookinete; yellow, other; grey, no peak expression) (Methods). Genes with high HKAr and a significant MK skew (square symbols): (1) merozoite surface protein 9, PF3D7_1228600; (2) rRNA (adenosine-2'-O-)-methyltransferase, PF3D7_1429400; (3) merozoite surface protein 1, PF3D7_0930300; (4) formin 1, PF3D7_0530900. b, Gene-wide HKAr values for the P. falciparum to P. reichenowi comparison, described earlier, versus HKAr for the P. o. curtisi to P. o. wallikeri (blue) and the P. malariae to P. malariae-like (red) comparisons. Five genes show significant HKAr (> 0.15) values for both comparisons: (1) ferrodoxin reductase-like protein (PF3D7_0720400); (2) EGF-like membrane protein (PF3D7_0623300); (3) ADP/ATP carrier protein (PF3D7_1004800); (4) merozoite surface protein 1 (PF3D7_0930300); (5) conserved Plasmodium protein (PF3D7_0311000). c, log2 of P values of gene-wide MK tests for the P. falciparum to P. reichenowi comparison10 by P. o. curtisi to P. o. wallikeri (blue) and P. malariae to P. malariae-like (red) comparisons. Three genes have significant MK skews (log2(P) < −3) for both comparisons: (1) glideosome-associated connectyor (PF3D7_1361800); (2) apical membrane antigen 1 (PF3D7_1133400); (3) NAD(P)H-dependent glutamate synthase (PF3D7_1435300). d, Nonsynonymous versus synonymous fixed mutations per gene for both the P. o. curtisi to P. o. wallikeri (blue) and the P. malariae to P. malariae-like (red) comparisons. Whereas the former has most genes centred around the x = y line, the latter has most genes below this line with more nonsynonymous than synonymous mutations, indicative of an ancestral bottleneck. e, Bar plot of proportion of P. malariae (above) and P. o. curtisi (below) genes expressed at different stages (no peak expression (grey), ookinete (blue), gametocyte (green), intraerythrocytic (red), and other stage (yellow)) binned by Ka/Ks, with the number of genes in each bin displayed (n). P. o. curtisi genes with very high Ka/Ks values (> 2.5) are enriched for genes with peak expression in gametocyte.
Extended Data Figure 4
Extended Data Figure 4. Reticulocyte-binding protein changes in P. malariae and P. ovale.
a, Phylogenetic tree of all full-length functional RBPs in P. malariae (red branches), P. o. curtisi (blue branches without stars), P. o. wallikeri (blue branches with stars), and P. vivax (green branches). Brackets indicate the different subclasses of RBPs: RBP1a, RBP1b, RBP2 and RBP3. b, ACT view of functional (orange) and pseudogenized (grey) RBP1a and RBP1b in five species (P. vivax, P. o. curtisi, P. o. wallikeri, P. malariae and P. malariae-like). Blue indicates assembly gaps. Red bars between species indicate level of sequence similarity, with darker colour indicating higher similarity. c, Number of RBP genes in each of the three RBP classes (RBP1, RBP2, RBP3) by species (P. vivax, P. o. curtisi, P. o. wallikeri, P. cynomolgi, P. malariae, P. knowlesi) grouped by erythrocyte invasion preference (reticulocyte versus normocyte). d, PhyML generated phylogenetic tree of all RBP genes over 1 kb long in P. o. curtisi and P. o. wallikeri. Pseudogenes are denoted with (P). Multiple functional RBP2 genes match up with pseudogenized copies in the other genome. e, ACT view of RBP1b in red for P. o. curtisi (bottom) and the corresponding disrupted open reading frame in P. o. wallikeri (top), with black ticks indicating stop codons. Reads (in blue) from an additional P. o. wallikeri sample (PowCR02) confirm the bases introducing the frameshift (green box) and premature stop codon (yellow box) in RBP1b.
Extended Data Figure 5
Extended Data Figure 5. Subtelomeric gene family dynamics in P. ovale and P. malariae.
a, Heat map showing the sharing of pir subfamilies between different species based on tribeMCL. Columns show pir subfamilies and rows show species. Colours indicate the number of genes classified into each subfamily for each species. Subfamilies were ordered by size, species were ordered for clarity. pir genes in rodent-infective species fall into a small number of well-defined families. Those in P. vivax, P. malariae and P. ovale, however, are much more diverse. There is little overlap between rodent subfamilies and human-infective subfamilies, despite P. ovale being a sister taxa to the rodent-infecting species. P. knowlesi has some sharing with other species, but its largest families are species specific, suggesting it has undergone specialization of its pir repertoire. b, Gene network of pir genes for both high-quality assemblies of P. o. curtisi (dark red) and P. o. wallikeri (dark blue) and draft assemblies of each (light red and light blue respectively). pir genes with BLASTP identity hits of 99% and over 150 amino acids become connected in the graph. Genes without connections were removed. There is one connection between the two species (circled in black and with a zoomed in version), 801 between the P. o. curtisi assemblies, 524 between the P. o. wallikeri assemblies, 527 on average within each P. o. curtisi assembly, and 423 on average within each P. o. wallikeri assembly. This indicates that there is considerably less sharing of pir genes between the two P. ovale species than within each species, as expected if the two do not recombine with each other. c, Mirror tree for 79 fam-m and fam-l doublets, where the two phylogenetic trees correspond to either of the families with lines connecting branch tips of the same doublet. 35 branches (red) were manually selected owing to exhibiting recent branching. Inset below shows the correlations as calculated by the Mirrortree webserver between the two trees for all branches (above, correlation = 0.19, P < 0.001) and red branches (below, correlation = 0.53, P < 0.001). This shows that the two families are co-evolving, especially when doublets that recently branched are selected, suggesting that the co-evolution may be disrupted over longer periods of time, potentially through recombination. d, Mirror tree for 79 pir and fam-m pseudo-doublets (Methods), where the two phylogenetic trees correspond to either of the families with lines connecting branch tips of the same doublet. We manually selected 35 branches (red) as they exhibited recent branching. Inset shows the correlations as calculated by the Mirrortree webserver between the two trees for all branches (above, correlation = −0.09, P > 0.05) and red branches (below, correlation = −0.10, P > 0.05). This shows that the two families are not co-evolving, and that subtelomeric location does not produce sporadic signals of co-evolution.
Figure 1
Figure 1. Prevalence of P. malariae and P. ovale with sample origins.
Presence and absence of P. malariae (red), P. ovale (blue) or both (purple) by country on the basis of a literature review (Supplementary Information). Bar plots show proportion of P. falciparum infections with co-infections of P. malariae (red), P. ovale (blue), P. vivax (green), or two species (purple) on the basis of the Pf3K data set (Supplementary Information; Methods). Stars indicate origin of sample used for reference genome assembly and points show additional samples used. Map sourced from Wikipedia Commons (https://commons.wikimedia.org/wiki/File:BlankMap-World6.svg).
Figure 2
Figure 2. Phylogenetic tree of the Plasmodium genus.
Maximum likelihood phylogenetic tree of the Plasmodium genus, showing the P. malariae clade (red) and the P. ovale clade (blue) together with the divergence levels of the species as calibrated to the P. falciparum and P. reichenowi split (×). Using a previously published date of 3.0–5.5 million year ago for the P. falciparum and P. reichenowi split, we thereby date the P. ovale split to 20.3 million years ago and the P. malariae split to 3.5 million years ago. Silhouettes show host specificity of the different species. Values at branching points are bootstrap values (Methods).
Figure 3
Figure 3. Subtelomeric gene family expansions in P. malariae and P. ovale.
a, Gene network based on sequence similarity of all genes in P. malariae (red), P. ovale (blue), and P. vivax (green). Cluster 1 contains fam-l genes, cluster 2 contains fam-m genes, and cluster 3 contains surfins and STP1 genes. b, Chromosome 5 subtelomeric localization of fam-l and fam-m genes in doublets (blue brackets) on the telomere-facing strand. Also showing pseudogenes (grey) and hypothetical gene (blue). c, Predicted 3D structure of fam-l (above) and fam-m (below) overlaid with the RH5 crystal structure (Purple). Right-hand images show the protein rotated to the right.

Comment in

  • A Feast of Malaria Parasite Genomes.
    Carlton JM, Sullivan SA. Carlton JM, et al. Cell Host Microbe. 2017 Mar 8;21(3):310-312. doi: 10.1016/j.chom.2017.02.019. Cell Host Microbe. 2017. PMID: 28279339 Free PMC article.

References

    1. Sutherland CJ, et al. Two nonrecombining sympatric forms of the human malaria parasite Plasmodium ovale occur globally. J Infect Dis. 2010;201:1544–1550. - PubMed
    1. Collins WE, Jeffery GM. Plasmodium malariae: parasite and disease. Clin Microbiol Rev. 2007;20:579–592. - PMC - PubMed
    1. Collins WE, Jeffery GM. Plasmodium ovale: parasite and disease. Clin Microbiol Rev. 2005;18:570–581. - PMC - PubMed
    1. Doderer-Lang C, et al. The ears of the African elephant: unexpected high seroprevalence of Plasmodium ovale and Plasmodium malariae in healthy populations in Western Africa. Malar J. 2014;13:240. - PMC - PubMed
    1. Bousema T, Okell L, Felger I, Drakeley C. Asymptomatic malaria infections: detectability, transmissibility and public health relevance. Nat Rev Microbiol. 2014;12:833–840. - PubMed

Publication types