. 2017 Apr;38(4):2260-2275.
doi: 10.1002/hbm.23519. Epub 2017 Jan 24.

Quantifying the variability of scene-selective regions: Interindividual, interhemispheric, and sex differences

Affiliations

Quantifying the variability of scene-selective regions: Interindividual, interhemispheric, and sex differences

Zonglei Zhen et al. Hum Brain Mapp. 2017 Apr.

Abstract

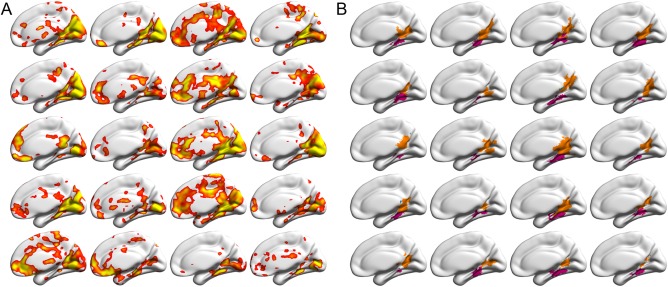
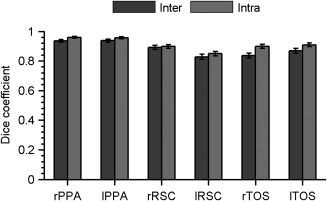
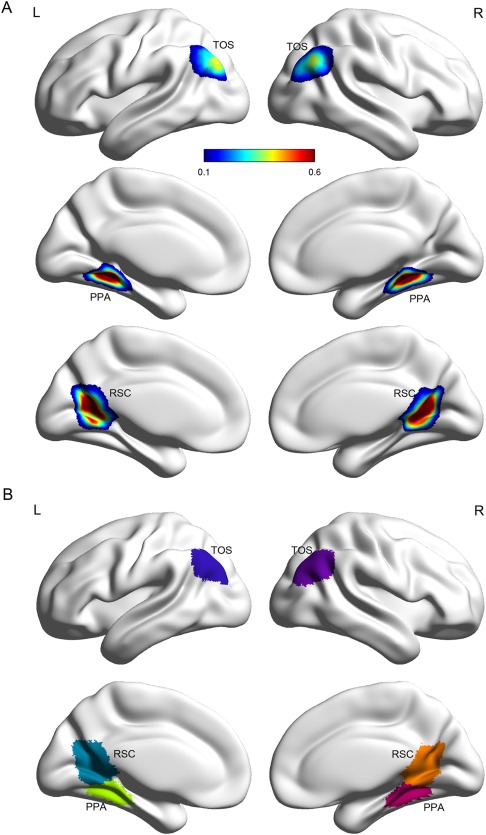
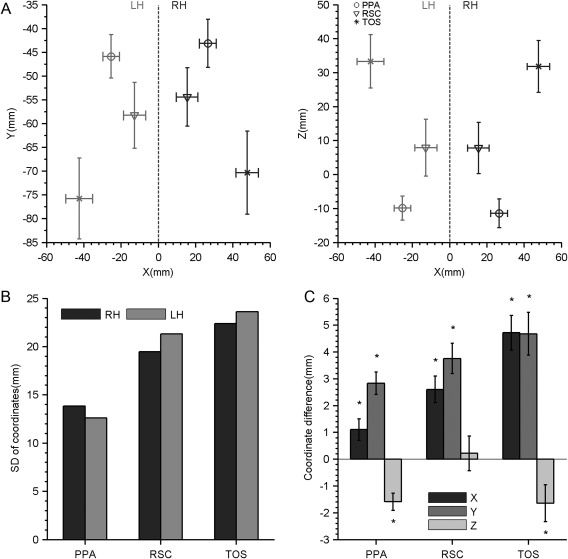
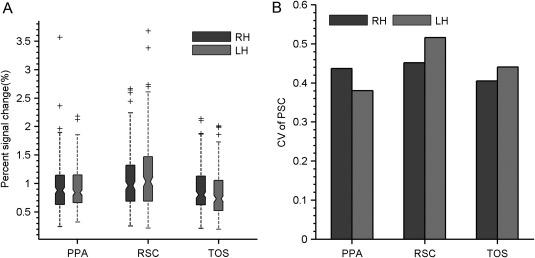
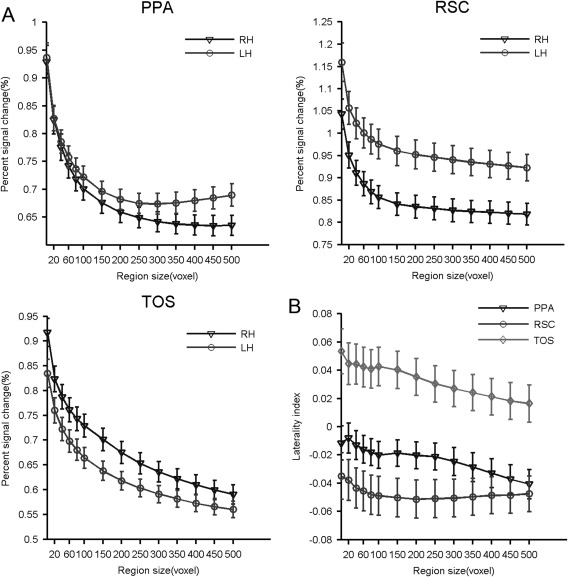
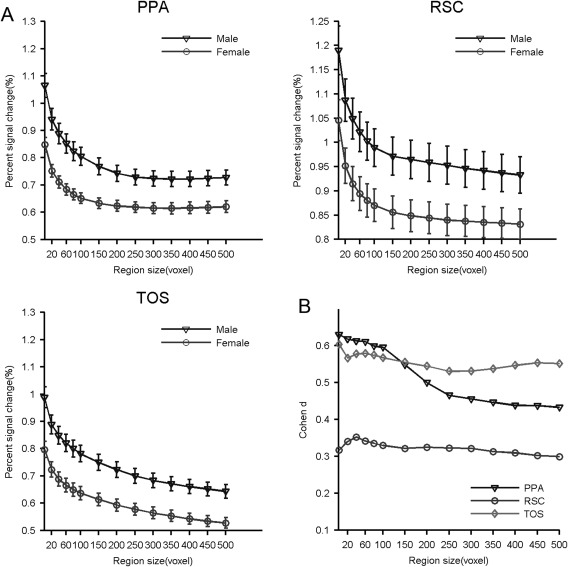
Scene-selective regions (SSRs), including the parahippocampal place area (PPA), retrosplenial cortex (RSC), and transverse occipital sulcus (TOS), are among the most widely characterized functional regions in the human brain. However, previous studies have mostly focused on the commonality within each SSR, providing little information on different aspects of their variability. In a large group of healthy adults (N = 202), we used functional magnetic resonance imaging to investigate different aspects of topographical and functional variability within SSRs, including interindividual, interhemispheric, and sex differences. First, the PPA, RSC, and TOS were delineated manually for each individual. We then demonstrated that SSRs showed substantial interindividual variability in both spatial topography and functional selectivity. We further identified consistent interhemispheric differences in the spatial topography of all three SSRs, but distinct interhemispheric differences in scene selectivity. Moreover, we found that all three SSRs showed stronger scene selectivity in men than in women. In summary, our work thoroughly characterized the interindividual, interhemispheric, and sex variability of the SSRs and invites future work on the origin and functional significance of these variabilities. Additionally, we constructed the first probabilistic atlases for the SSRs, which provide the detailed anatomical reference for further investigations of the scene network. Hum Brain Mapp 38:2260-2275, 2017. © 2017 Wiley Periodicals, Inc.

Keywords: individual differences; interhemispheric differences; interindividual variability; scene-selective regions (SSRs); sex differences.


Figures

Figure 1
Figure 1
Sample activations and delineated SSRs in the right hemispheres from the 20 randomly selected brains, overlaid on the standard MNI152 cortical surfaces. Because of space limitations, only the medial view is presented. For the lateral view, see Supporting Information Figure S2. (A) The individual activation maps for the contrast between scenes and objects, derived from three runs of fMRI data for each subject, uncorrected P < 0.01 (right‐tailed). (B) The delineated subject‐specific SSRs for the activations in (A). PPA and RSC were shown in magenta and orange, respectively. Each cell corresponds to one subject. Abbreviations: PPA, parahippocampal place area; RSC, retrosplenial cortex; SSR, scene‐selective region. [Color figure can be viewed at http://wileyonlinelibrary.com]
Figure 2
Figure 2
Intra‐rater and inter‐rater reliability for the delineation of SSRs measured by the Dice coefficient. A value of 1.0 indicates identical sets of voxels in two labels, while 0.0 represents completely different sets of voxels. The reliability was calculated separately for the right and left SSRs. Abbreviations: PPA, parahippocampal place area; RSC, retrosplenial cortex; SSR, scene‐selective region; TOS, transverse occipital sulcus; L, left hemisphere; R, right hemisphere.
Figure 3
Figure 3
Probabilistic atlas and maximum probability map for the SSRs. (A) Probabilistic atlas displayed on the standard MNI152 cortical surface. The probability was calculated as the frequency of a respective SSR presented at a given position across all subjects. (B) Maximum probability map visualized as overlays on the MNI152 cortical surface. The value for voxels in which the maximal probability was smaller than 0.1 was set to zero, indicating that they most likely did not belong to any SSRs. Abbreviations: PPA, parahippocampal place area; RSC, retrosplenial cortex; SSR, scene‐selective region; TOS, transverse occipital sulcus; L, left hemisphere; R, right hemisphere.
Figure 4
Figure 4
The interindividual and interhemispheric variability for the location of peak activation. (A) The mean coordinates (mm) and standard deviations (SDs) of the peak activation in the SSRs calculated from the individual brains in the axial (left) and coronal (right) planes. (B) Interindividual variations for the location of peak activation, quantified by the sum of SD from the three coordinate axes. (C) Interhemispheric differences for the location of peak activation, quantified by the coordinate differences on each coordinate axis. Asterisks indicate P < 0.05. Abbreviations: PPA, parahippocampal place area; RSC, retrosplenial cortex; SSR, scene‐selective region; TOS, transverse occipital sulcus; LH, left hemisphere; RH, right hemisphere.
Figure 5
Figure 5
The interindividual variability of scene selectivity. (A) The distribution of scene selectivity was summarized by a boxplot for each SSR. (B) Interindividual variation in scene selectivity quantified by the coefficient of variation. Abbreviations: PPA, parahippocampal place area; RSC, retrosplenial cortex; SSR, scene‐selective region; TOS, transverse occipital sulcus; LH, left hemisphere; RH, right hemisphere.
Figure 6
Figure 6
Interhemispheric differences in the scene selectivity of each SSR, measured at different region sizes. (A) The scene selectivity of SSRs from the right and left hemispheres. (B) The effect size of the interhemispheric differences calculated by the laterality index. Abbreviations: PPA, parahippocampal place area; RSC, retrosplenial cortex; SSR, scene‐selective region; TOS, transverse occipital sulcus; LH, left hemisphere; RH, right hemisphere.
Figure 7
Figure 7
Sex difference in the scene selectivity of the SSRs measured at different region sizes. (A) Scene selectivity of the SSRs in males and females. (B) The effect size of the sex difference calculated by Cohen's d. Abbreviations: PPA, parahippocampal place area; RSC, retrosplenial cortex; SSR, scene‐selective region; TOS, transverse occipital sulcus.

References

    1. Adcock JE, Wise RG, Oxbury JM, Oxbury SM, Matthews PM (2003): Quantitative fMRI assessment of the differences in lateralization of language‐related brain activation in patients with temporal lobe epilepsy. Neuroimage 18:423–438. - PubMed
    1. Aguirre GK, Detre JA, Alsop DC, D'Esposito M (1996): The parahippocampus subserves topographical learning in man. Cereb Cortex 6:823–829. - PubMed
    1. Aguirre GK, Zarahn E, D'Esposito M (1998): The variability of human, BOLD hemodynamic responses. Neuroimage 8:360–369. - PubMed
    1. Aminoff EM, Tarr MJ (2015): Associative processing is inherent in scene perception. PLoS One 10:e0128840. - PMC - PubMed
    1. Amunts K, Schleicher A, Burgel U, Mohlberg H, Uylings HB, Zilles K (1999): Broca's region revisited: Cytoarchitecture and intersubject variability. J Comp Neurol 412:319–341. - PubMed

Publication types

LinkOut - more resources