. 2017 Jan 24:6:e20707.
doi: 10.7554/eLife.20707.

Novel adverse outcome pathways revealed by chemical genetics in a developing marine fish

Affiliations

Novel adverse outcome pathways revealed by chemical genetics in a developing marine fish

Elin Sørhus et al. Elife. .

Abstract

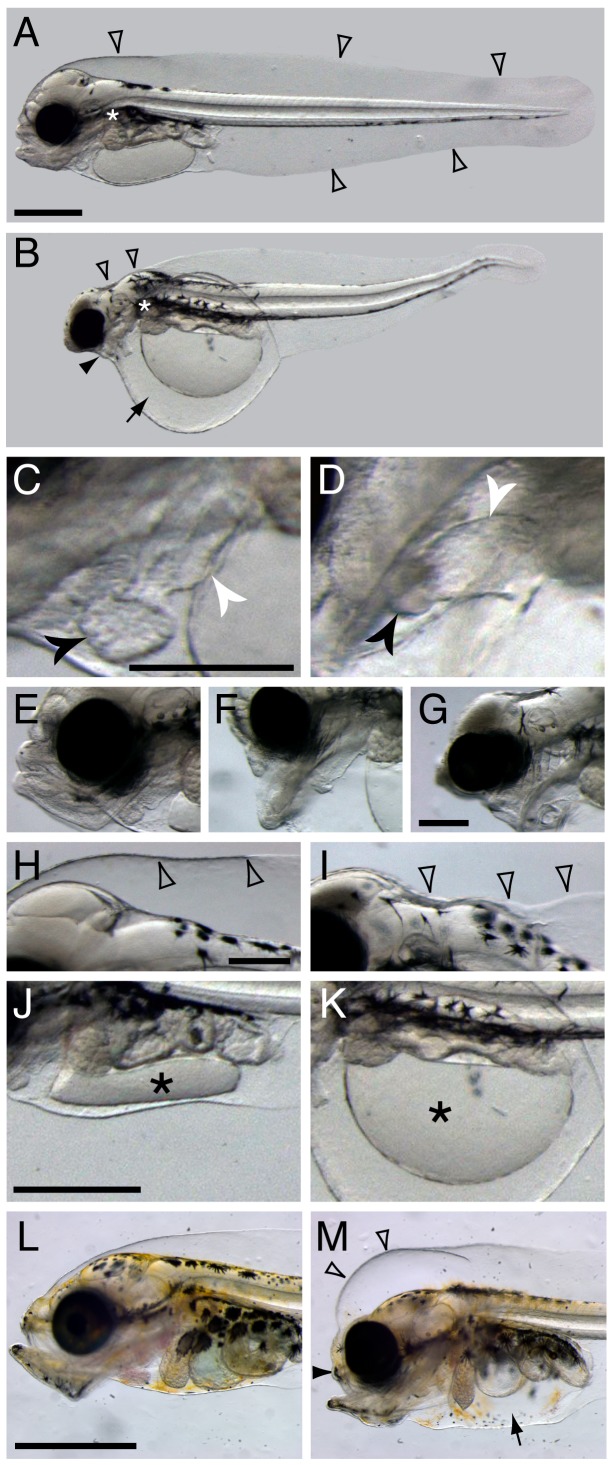
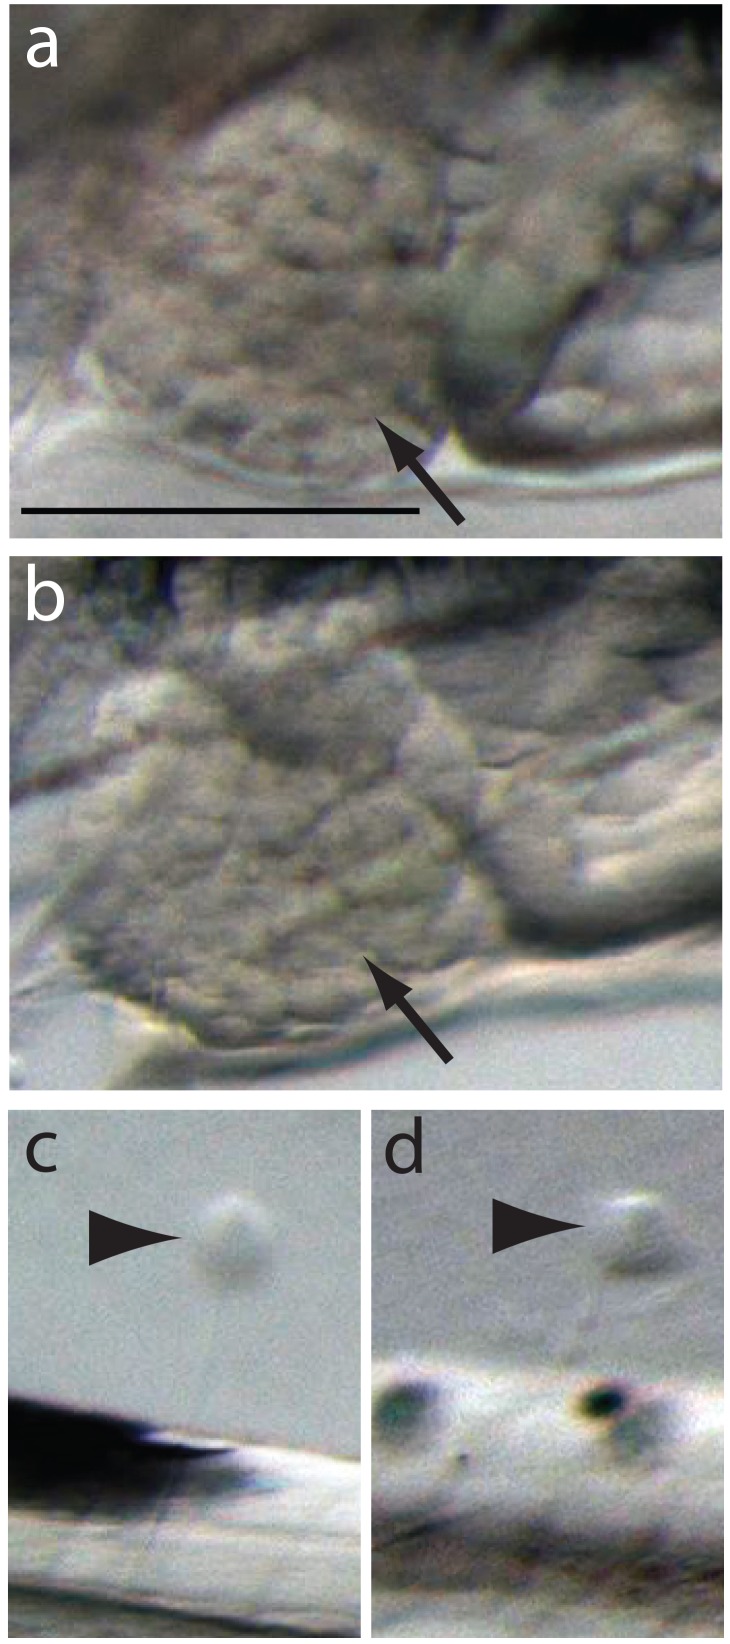
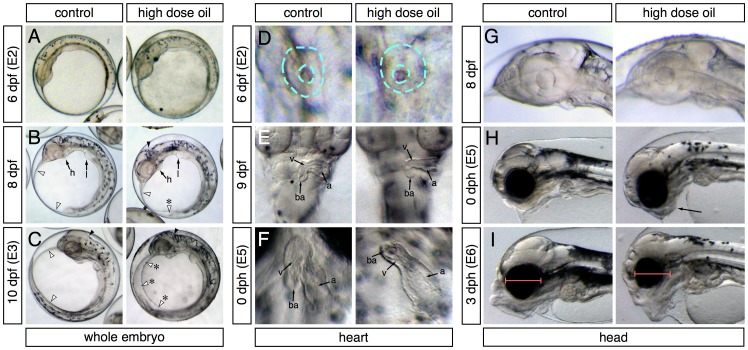
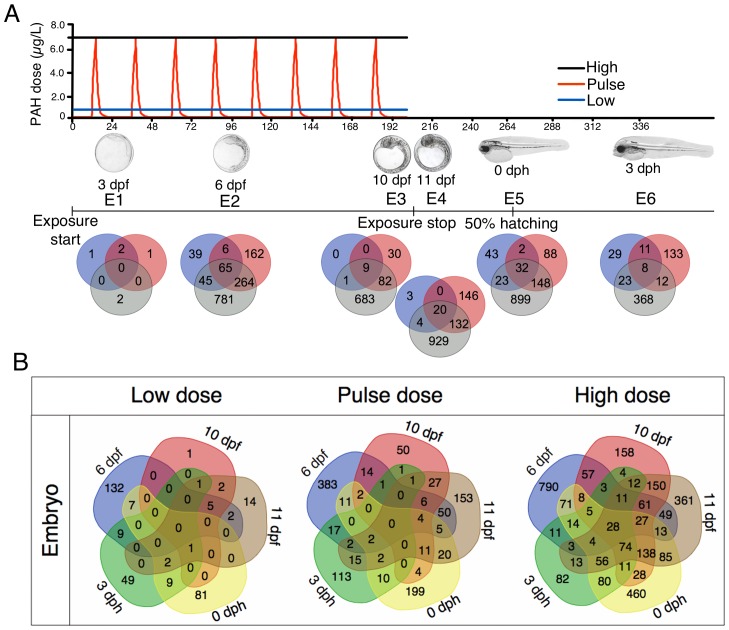
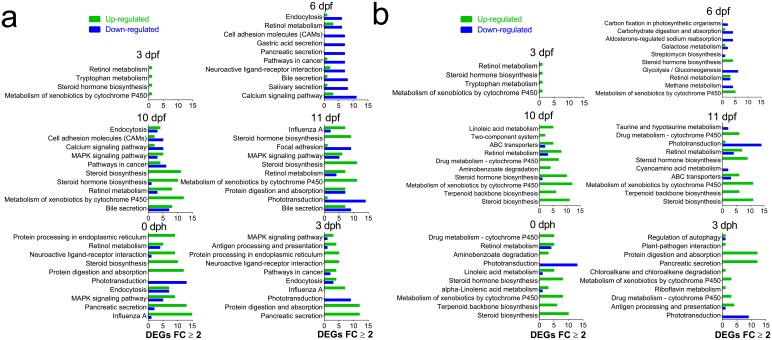
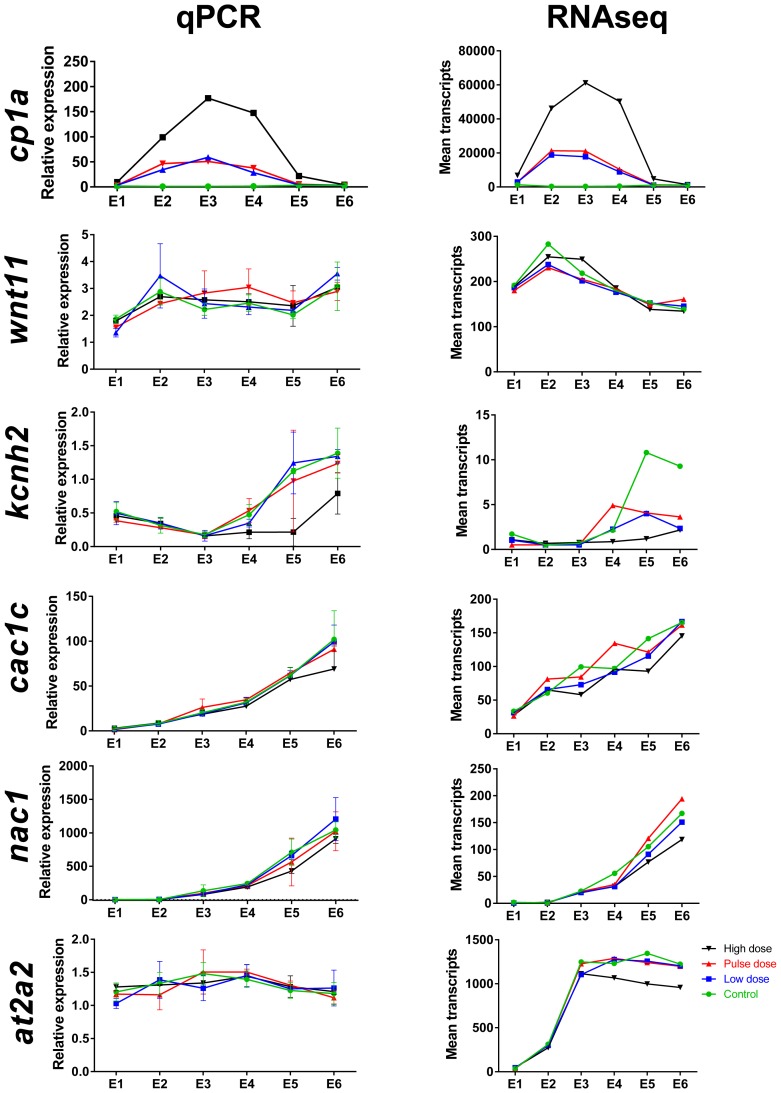
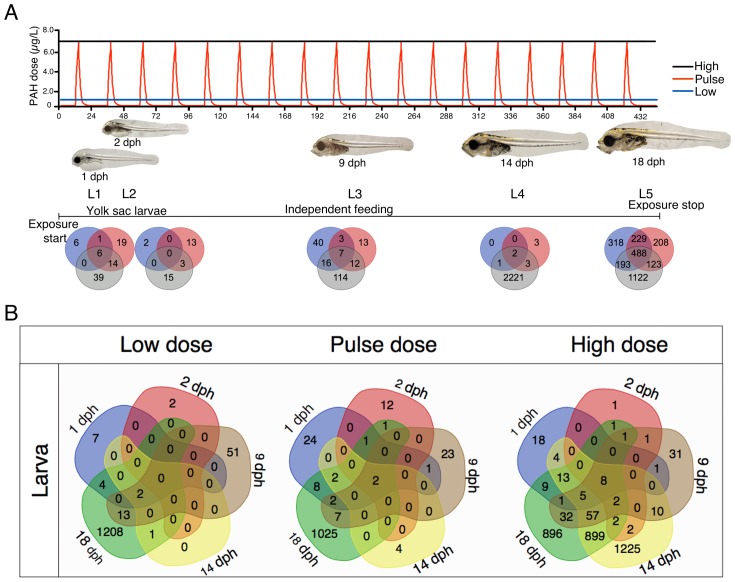
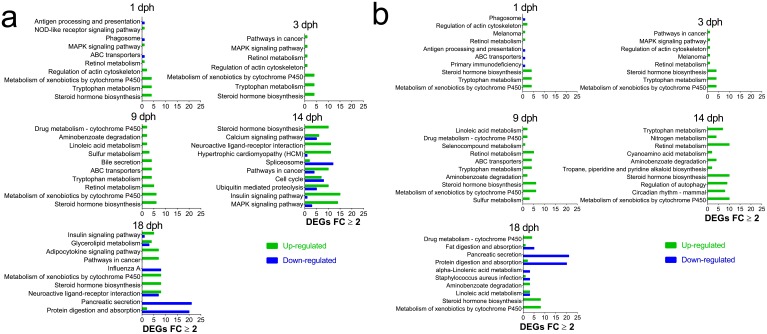
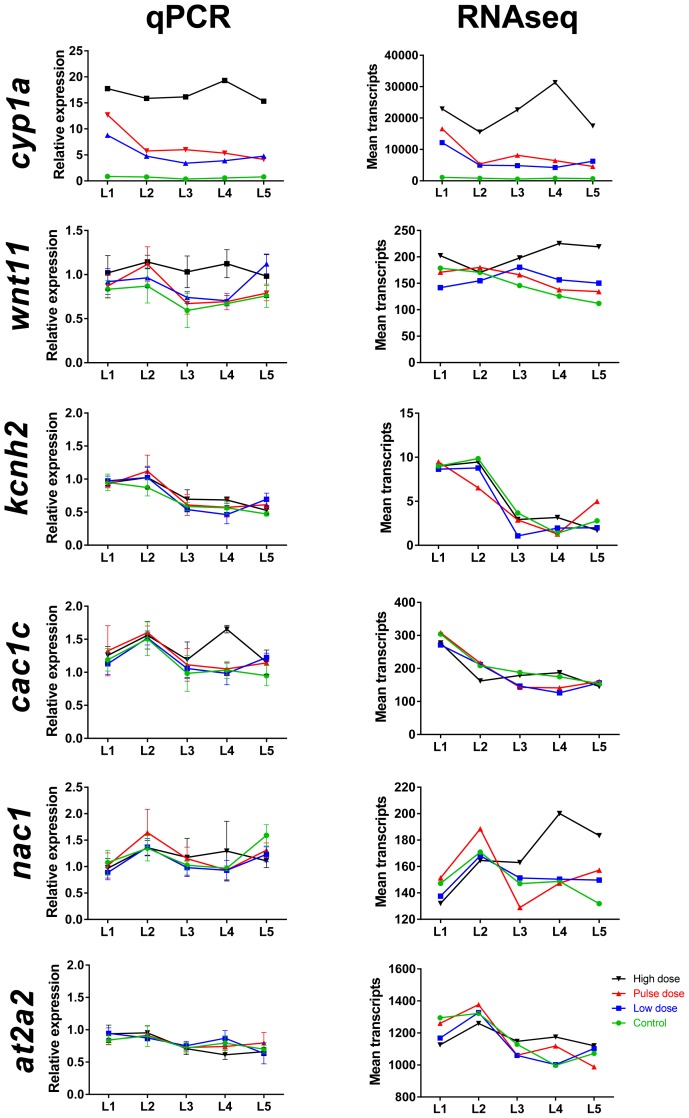
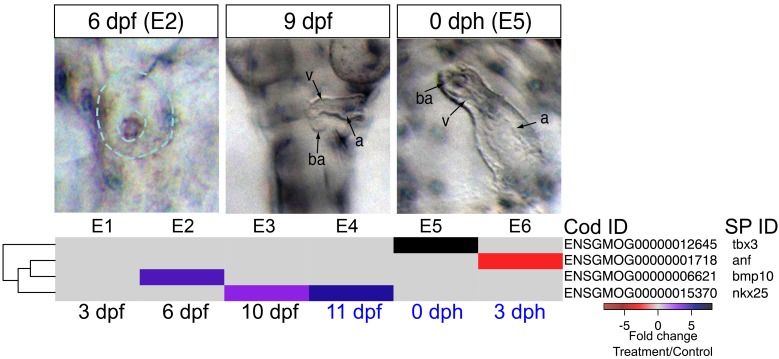
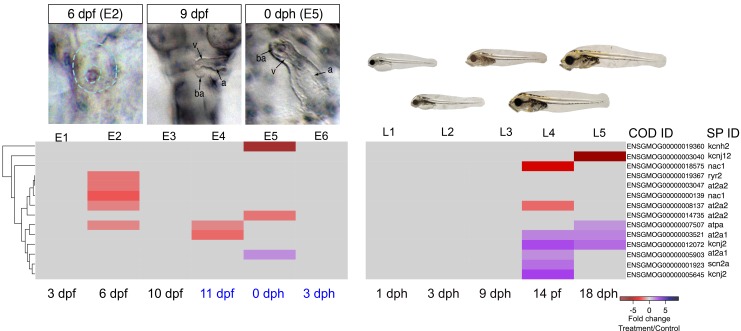
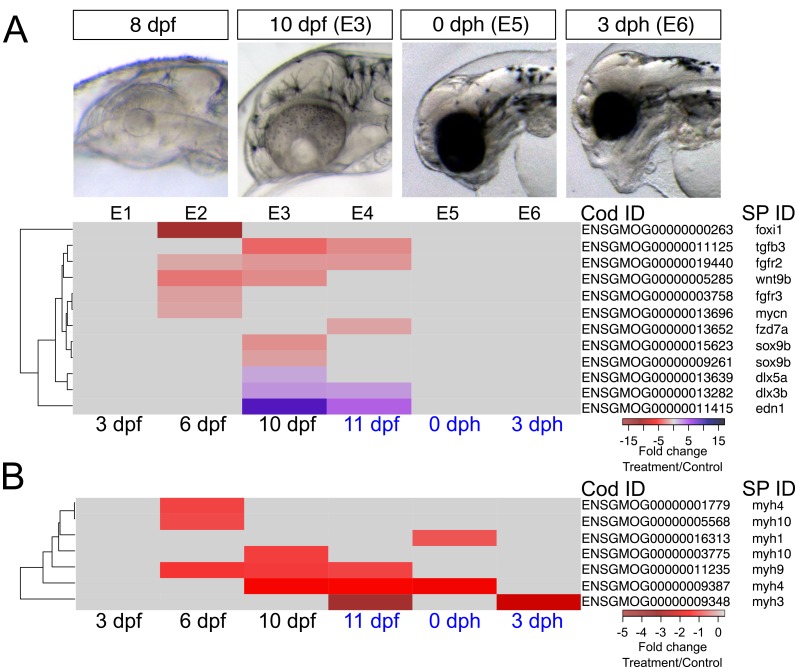
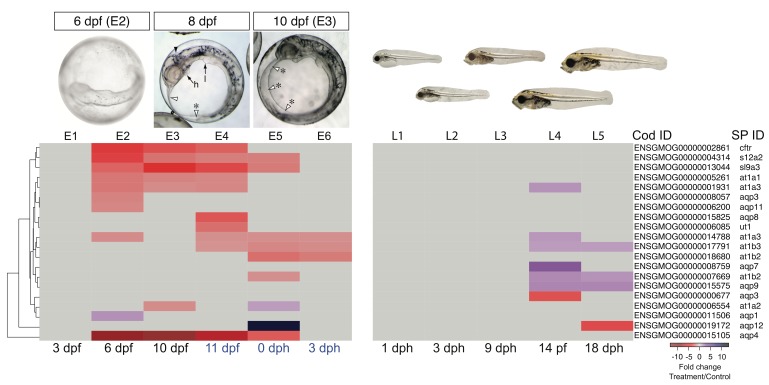
Crude oil spills are a worldwide ocean conservation threat. Fish are particularly vulnerable to the oiling of spawning habitats, and crude oil causes severe abnormalities in embryos and larvae. However, the underlying mechanisms for these developmental defects are not well understood. Here, we explore the transcriptional basis for four discrete crude oil injury phenotypes in the early life stages of the commercially important Atlantic haddock (Melanogrammus aeglefinus). These include defects in (1) cardiac form and function, (2) craniofacial development, (3) ionoregulation and fluid balance, and (4) cholesterol synthesis and homeostasis. Our findings suggest a key role for intracellular calcium cycling and excitation-transcription coupling in the dysregulation of heart and jaw morphogenesis. Moreover, the disruption of ionoregulatory pathways sheds new light on buoyancy control in marine fish embryos. Overall, our chemical-genetic approach identifies initiating events for distinct adverse outcome pathways and novel roles for individual genes in fundamental developmental processes.

Keywords: Atlantic haddock; cardiac abnormalities; chemical genetics; craniofacial abnormalities; crude oil; ecology; evolutionary biology; genomics; transcriptome.


Conflict of interest statement

The authors declare that no competing interests exist.

Figures

Figure 1.
Figure 1.. Terminal phenotypes after high dose exposure.
Control (A) and exposed (B) three days post hatch (dph) larvae (6 days post embryonic exposure). Open arrowheads in (A) indicate the marginal finfold surrounding the larvae and the white asterisk indicate the location of the connection between the dorsal space and the ventral yolk sac in the vicinity of the pectoral fin. In (B) the black arrowhead indicates severely reduced craniofacial outgrowth, while the black arrow indicates yolk sac edema. The ventricle and atrium in control (C) and embryonically exposed (D) animals are indicated by black and white arrows, respectively. (E) Normal craniofacial structure in control, and (F) moderate and (G) severe craniofacial defects in exposed animals. (H) Normal marginal finfold in control, (I) exposed animals with severe reduction of anterior marginal finfold (open arrowheads). Yolk mass (*) in control (J) and embryonically exposed larvae (K). (L) Control and (M) exposed 18 dph larvae. Open arrowheads indicate increased anterior marginal finfold, black arrowhead indicates reduced upper jaw outgrowth, and black arrow indicates edema formation in the peritoneal cavity in oil-exposed larvae (M). Scale bar: 0.2 mm (C,D; EG; HK) and 1 mm (A,B and L,M). DOI: http://dx.doi.org/10.7554/eLife.20707.003
Figure 1—figure supplement 1.
Figure 1—figure supplement 1.. Normal development of liver and lateral line in the severe phenotypes.
Normally developed livers and neuromast cells are indicated by black arrows and arrowheads in control (A, C) and severely affected hunchback phenotypes (B, D), respectively. Scale bar 0.2 mm. DOI: http://dx.doi.org/10.7554/eLife.20707.004
Figure 2.
Figure 2.. Appearance of phenotypes over time.
In each panel control and high-dose-exposed embryos are shown on the left and right, respectively. (AC) Lateral overview of whole embryos showing accumulation of edema (anterior to the left). (A) 6 dpf/E2 sampling point. (B) 8 dpf (between E2 and E3 sampling points). Heart (h) and liver bud (l) are indicated. White arrowheads indicate outer margins of the yolk sac membranes; asterisk indicates small pocket of edema. Black arrowheads indicate the hindbrain ventricle. (C) 10 dpf/E3 sampling point. Arrowheads same as (B); asterisks indicate expanded yolk sac edema. (DE) High-magnification ventral views of the heart (anterior at top). (D) 6 dpf/E2. Dashed turquoise lines indicate outer border and lumen of midline cardiac cone. (E) 9 dpf (between E2 and E3). Arrows indicate the atrium (a), ventricle (v) and bulbus arteriosus (ba). (F) 0 dph (E5 sampling point). Chambers indicated as in (E). (GI) Lateral views of the developing head (anterior to the left). (G) 8 dpf (between E2 and E3). (H) 0 dph (E5). Arrow indicates abnormal lower jaw cartilages in oil-exposed larva. (I) 3 dph (E6 sampling point). Red bars indicate difference in eye diameter between control and exposed larvae. DOI: http://dx.doi.org/10.7554/eLife.20707.005
Figure 3.
Figure 3.. Exposure regimes and differentially expressed genes (DEGs) during embryonic development.
(A) Embryos were exposed to a continuous high dose (black line; 6.7 ± 0.2 μg/L TPAH), a pulsed dose (red line; 0.09 ± 0.02–6.8 ± 1.0 μg/L TPAH) and a continuous low dose (blue line; 0.58 ± 0.05 μg/L TPAH) of crude oil. Photos indicate normal developmental progress at each of six sampling time points (E1–E6). Venn diagrams show shared and exclusive DEGs for each of the three oil exposures at E1–E6. (B) Venn diagrams illustrating the number of shared and exclusive DEGs at each stage in development up to hatching for the three exposure regimes. DOI: http://dx.doi.org/10.7554/eLife.20707.006
Figure 3—figure supplement 1.
Figure 3—figure supplement 1.. Most regulated KEGG pathways.
(A) Pathways (Total) with highest number of DEGs ≥2 FC during and after embryonic exposure. (B) Pathways with the largest fraction of DEGs ≥2 FC/ Total number of genes in pathway (Normalized) during and after embryonic exposure. DOI: http://dx.doi.org/10.7554/eLife.20707.007
Figure 3—figure supplement 2.
Figure 3—figure supplement 2.. Comparison of mRNA read count data with real-time qPCR for selected genes during and after embryonic exposure.
Genes include cp1a (cytochrome p450 1 a), wnt11 (wingless-type MMTV integration site family member 11), kcnh2 (potassium voltage-gated channel subfamily H member 2), cac1c (voltage-dependent L-type calcium channel), nac1 (sodium/calcium exchanger 1), at2a2 (sarcoplamsic-endoplasmic reticulum calcium ATPase). (A) Real-time qPCR. (B) Read count data from RNA sequencing. Data were normalized as described in Materials and methods. DOI: http://dx.doi.org/10.7554/eLife.20707.008
Figure 4.
Figure 4.. Exposure regimes and differentially expressed genes (DEGs) during larval development.
(A) Larvae were exposed to a continuous high dose (black line; 7.6 ± 0.7 μg/L TPAH), a pulsed dose (red line; 0.3 ± 0.3–6.1 ± 0.5 μg/L TPAH), and a continuous low dose (blue line; 0.65 ± 0.08 μg/L TPAH) of crude oil. Photos indicate normal developmental progress at each of five sampling time points (L1–L5). Venn diagrams show shared and exclusive DEGs for each of the three oil exposures at L1–5. (B) Venn diagrams illustrating the number of shared and exclusive DEGs at each larval stage for the three exposure regimes. DOI: http://dx.doi.org/10.7554/eLife.20707.010
Figure 4—figure supplement 1.
Figure 4—figure supplement 1.. Most regulated KEGG pathways.
(A) Pathways (Total) with highest number of DEGs ≥2 FC during larval exposure. (B) Pathways with the largest fraction of DEGs ≥2 FC/ Total number of genes in pathway (Normalized) during and after embryonic exposure. DOI: http://dx.doi.org/10.7554/eLife.20707.011
Figure 4—figure supplement 2.
Figure 4—figure supplement 2.. Comparison of mRNA read count data with real time qPCR for selected genes during larval exposure.
Genes include cp1a (cytochrome p450 1 a), wnt11, kcnh2 (potassium voltage-gated channel subfamily H member 2), cac1c (voltage-dependent L-type calcium channel), nac1 (sodium/calcium exchanger 1), and at2a2 (sarcoplamsic-endoplasmic reticulum calcium ATPase). (A) Real-time qPCR. (B) Read count data from RNA sequencing. Data were normalized as described in Materials and methods. DOI: http://dx.doi.org/10.7554/eLife.20707.012
Figure 5.
Figure 5.. DEGs involved in cardiogenesis.
Regulation of genes involved in cardiogenesis during and after embryonic exposure. Purple: increased expression, red: decreased expression in exposed group. DOI: http://dx.doi.org/10.7554/eLife.20707.015
Figure 6.
Figure 6.. DEGs involved in E–C coupling.
Embryonic developmental samples (E1–6) were collected during (black lettering) and after (blue lettering) crude oil exposure. Oil exposure was continuous across the larval sampling points (L1–5). DOI: http://dx.doi.org/10.7554/eLife.20707.016
Figure 7.
Figure 7.. DEGs involved in craniofacial development.
(a) Regulation of genes involved in craniofacial development during and after embryonic exposure. (b) Regulation of myosin heavy chain genes. Purple: increased expression, red: decreased expression in exposed group. DOI: http://dx.doi.org/10.7554/eLife.20707.017
Figure 8.
Figure 8.. DEGs involved in osmoregulation.
E1–E6: Embryonic exposure, L1–L5: Larval exposure. Black letters: during exposure, blue letters: after exposure. DOI: http://dx.doi.org/10.7554/eLife.20707.018

Similar articles

Cited by

References

    1. Acton S, Rigotti A, Landschulz KT, Xu S, Hobbs HH, Krieger M. Identification of scavenger receptor SR-BI as a high density lipoprotein receptor. Science. 1996;271:518–520. doi: 10.1126/science.271.5248.518. - DOI - PubMed
    1. Adams J, Bornstein JM, Munno K, Hollebone B, King T, Brown RS, Hodson PV. Identification of compounds in heavy fuel oil that are chronically toxic to rainbow trout embryos by effects-driven chemical fractionation. Environmental Toxicology and Chemistry. 2014;33:825–835. doi: 10.1002/etc.2497. - DOI - PubMed
    1. Andersen Ø, Frantzen M, Rosland M, Timmerhaus G, Skugor A, Krasnov A. Effects of crude oil exposure and elevated temperature on the liver transcriptome of polar cod (Boreogadus saida) Aquatic Toxicology. 2015;165:9–18. doi: 10.1016/j.aquatox.2015.04.023. - DOI - PubMed
    1. Andrés-Delgado L, Mercader N. Interplay between cardiac function and heart development. Biochimica et Biophysica Acta (BBA) - Molecular Cell Research. 2016;1863:1707–1716. doi: 10.1016/j.bbamcr.2016.03.004. - DOI - PMC - PubMed
    1. Ankley GT, Bennett RS, Erickson RJ, Hoff DJ, Hornung MW, Johnson RD, Mount DR, Nichols JW, Russom CL, Schmieder PK, Serrrano JA, Tietge JE, Villeneuve DL. Adverse outcome pathways: a conceptual framework to support ecotoxicology research and risk assessment. Environmental Toxicology and Chemistry. 2010;29:730–741. doi: 10.1002/etc.34. - DOI - PubMed

Publication types