Comparative Study
. 2017 Feb;101(2):302-309.
doi: 10.1097/TP.0000000000001278.

CD45RA Distinguishes CD4+CD25+CD127-/low TSDR Demethylated Regulatory T Cell Subpopulations With Differential Stability and Susceptibility to Tacrolimus-Mediated Inhibition of Suppression

Affiliations
Comparative Study

CD45RA Distinguishes CD4+CD25+CD127-/low TSDR Demethylated Regulatory T Cell Subpopulations With Differential Stability and Susceptibility to Tacrolimus-Mediated Inhibition of Suppression

Rebeca Arroyo Hornero et al. Transplantation. 2017 Feb.

Abstract

Background: Adoptive transfer of forkhead box protein (FOX)3 regulatory T (Treg) cells offers a promising strategy to reduce damage to an allograft by the recipient's immune system. Identification of cell surface markers sufficient to purify Treg cells expanded ex vivo to remove cellular contaminants requires optimization. Furthermore, the expanded Treg must be able to survive, expand, and suppress in allograft recipients exposed to immunosuppressants, such as tacrolimus (TAC). Reduced CD127 expression enhances identification of Treg in the human CD4CD25 population. CD45RA expression identifies naive CD4CD25 Treg with an enhanced stability of Treg phenotype.

Methods: We combine an analysis of CD45RA, CD25, and CD127 expression to identify subpopulations of CD4CD127CD25 cells. Regulatory T cells were sorted according to expression of CD25 and CD45RA and expanded in the presence of a physiological relevant concentration of TAC. Regulatory T cell-specific demethylation region (TSDR) demethylation, FOXP3 expression, and suppression were analyzed.

Results: CD4CD127CD25CD45RA Treg cells had a stable TSDR demethylated FOXP3 phenotype after expansion whereas CD4CD127CD25CD45RA Treg cell lost the TSDR demethylated phenotype. CD45RA Treg had a greater capacity to suppress after expansion with TAC.

Conclusions: Although CD45RA Treg retained a greater suppressive capacity when expanded with TAC, the marked loss of the TSDR demethylated status highlights the potential for loss of stability of these cells in transplant recipients treated with TAC based immunosuppression. We show that a population of CD4CD127CD45RA Regulatory T cell may offer the best compromise between susceptibility to loss of suppression when exposed to TAC and maintenance of a TSDR demethylated phenotype following in vitro expansion.


Conflict of interest statement

The authors declare no conflicts of interest.

Figures

FIGURE 1
FIGURE 1
Treg phenotyping. A, Gating strategies to isolate total Treg (CD127−/lowCD25+); naive Treg (CD127−/lowCD25intCD45RA+); CD25int mTreg (CD127−/lowCD25intCD45RA); and CD25hi mTreg (CD127−/lowCD25hiCD45RA). B, Percentages of cells with demethylated TSDR (n = 11) and (C) percentage of cells that express FOXP3 (n = 12) before expansion (Mann-Whitney U test, *P < 0.05, **P < 0.01, ***P < 0.001). Median with interquartile range is represented.
FIGURE 2
FIGURE 2
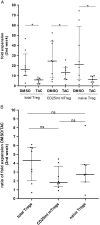
Expansion capacity of Treg cell populations. A, Fold expansion in each Treg cell population was measured after in vitro expansion in the presence of DMSO or TAC (Wilcoxon-matched pair test), comparing day 7 with day 14 cell numbers. B, Ratio of proliferation between each Treg cell population incubated with DMSO or TAC (Mann-Whitney U test). n = 12 donors are shown (*P < 0.05, **P < 0.01, ***P < 0.001). Median with interquartile range is represented.
FIGURE 3
FIGURE 3
Foxp3 expression and demethylation status of the TSDR region of expanded Treg cell subsets. A, Percentages of TSDR demethylation (n = 8 donors); B, cells expressing Foxp3 (n = 8 donors); C, cells expressing CD27 (n = 7 donors); and D, ratio of cells that express FOXP3 and with a demethylated TSDR were measured in each Treg cell population before and after in vitro expansion in the presence of DMSO or TAC. For statistical analysis, Wilcoxon-matched pair test was performed comparing, CD27 expression, Foxp3 expression, TSDR demethylation or FOXP3+/demethylated TSDR ratio between the respective Treg population after being exposing to DMSO or TAC, and the Mann-Whitney U test was used to compare between cell populations (*P < 0.05, **P < 0.01, ***P < 0.001). Median with interquartile range is represented.
FIGURE 4
FIGURE 4
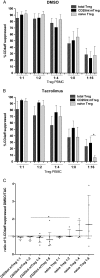
In vitro suppressive capacity of Treg cell populations. A, Suppressive capacity of CD25int mTreg and naive Treg (n = 6 donors), and total Treg (n = 5 donors) after in vitro expansion in DMSO control media. B, Suppressive capacity of CD25int mTreg and naive Treg (n = 6 and n = 5 donors, respectively), and total Treg cells (n = 5 donors) after in vitro expansion in the presence of TAC. Percent suppression of CD4+ effector cell proliferation based on division index of PBMCs compared with the proliferation of PBMCs cultured in the absence of suppressor cells. Each data point is the average of 3 replicate wells in the suppression assay of each donor. Mann-Whitney U test used to compare suppression between Treg subpopulations (*P < 0.05). Mean with SEM is represented. C, Ratio of percentage suppression between Treg expanded in DMSO and TAC containing media, using titrated numbers of Treg to Teff cells. (n = 6 donors; Mann-Whitney U test, *P < 0.05). Median with interquartile range is represented.
FIGURE 5
FIGURE 5
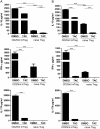
Cytokine production of Treg cell subpopulations. IL-10, IFN-γ, and IL-17A production by CD25int mTreg and naive Treg cells after in vitro expansion in the presence of TAC or DMSO was determined in triplicate wells in 2 different donors (A and B). Bars represent means with SEM (***P < 0.001).

References

    1. Marcen R. Immunosuppressive drugs in kidney transplantation: impact on patient survival, and incidence of cardiovascular disease, malignancy and infection. Drugs. 2009;69:2227–2243. - PubMed
    1. Wood KJ, Bushell A, Hester J. Regulatory immune cells in transplantation. Nat Rev Immunol. 2012;12:417–430. - PubMed
    1. van der Net JB, Bushell A, Wood KJ, et al. Regulatory T cells: first steps of clinical application in solid organ transplantation. Transpl Int. 2016;29:3–11. - PubMed
    1. Klatzmann D, Abbas AK. The promise of low-dose interleukin-2 therapy for autoimmune and inflammatory diseases. Nat Rev Immunol. 2015;15:283–294. - PubMed
    1. Malek TR, Castro I. Interleukin-2 receptor signaling: at the interface between tolerance and immunity. Immunity. 2010;33:153–165. - PMC - PubMed

Publication types

MeSH terms