

The World Health Organization Fetal Growth Charts: A Multinational Longitudinal Study of Ultrasound Biometric Measurements and Estimated Fetal Weight
- PMID: 28118360
- PMCID: PMC5261648
- DOI: 10.1371/journal.pmed.1002220
The World Health Organization Fetal Growth Charts: A Multinational Longitudinal Study of Ultrasound Biometric Measurements and Estimated Fetal Weight
Erratum in
-
Correction: The World Health Organization Fetal Growth Charts: A Multinational Longitudinal Study of Ultrasound Biometric Measurements and Estimated Fetal Weight.PLoS Med. 2017 Mar 24;14(3):e1002284. doi: 10.1371/journal.pmed.1002284. eCollection 2017 Mar. PLoS Med. 2017. PMID: 28339475 Free PMC article.
-
Correction: Correction: The World Health Organization Fetal Growth Charts: A Multinational Longitudinal Study of Ultrasound Biometric Measurements and Estimated Fetal Weight.PLoS Med. 2017 Apr 20;14(4):e1002301. doi: 10.1371/journal.pmed.1002301. eCollection 2017 Apr. PLoS Med. 2017. PMID: 29194459 Free PMC article.
-
Correction: The World Health Organization Fetal Growth Charts: A Multinational Longitudinal Study of Ultrasound Biometric Measurements and Estimated Fetal Weight.PLoS Med. 2021 Jan 7;18(1):e1003526. doi: 10.1371/journal.pmed.1003526. eCollection 2021 Jan. PLoS Med. 2021. PMID: 33411728 Free PMC article.
Abstract
Background: Perinatal mortality and morbidity continue to be major global health challenges strongly associated with prematurity and reduced fetal growth, an issue of further interest given the mounting evidence that fetal growth in general is linked to degrees of risk of common noncommunicable diseases in adulthood. Against this background, WHO made it a high priority to provide the present fetal growth charts for estimated fetal weight (EFW) and common ultrasound biometric measurements intended for worldwide use.
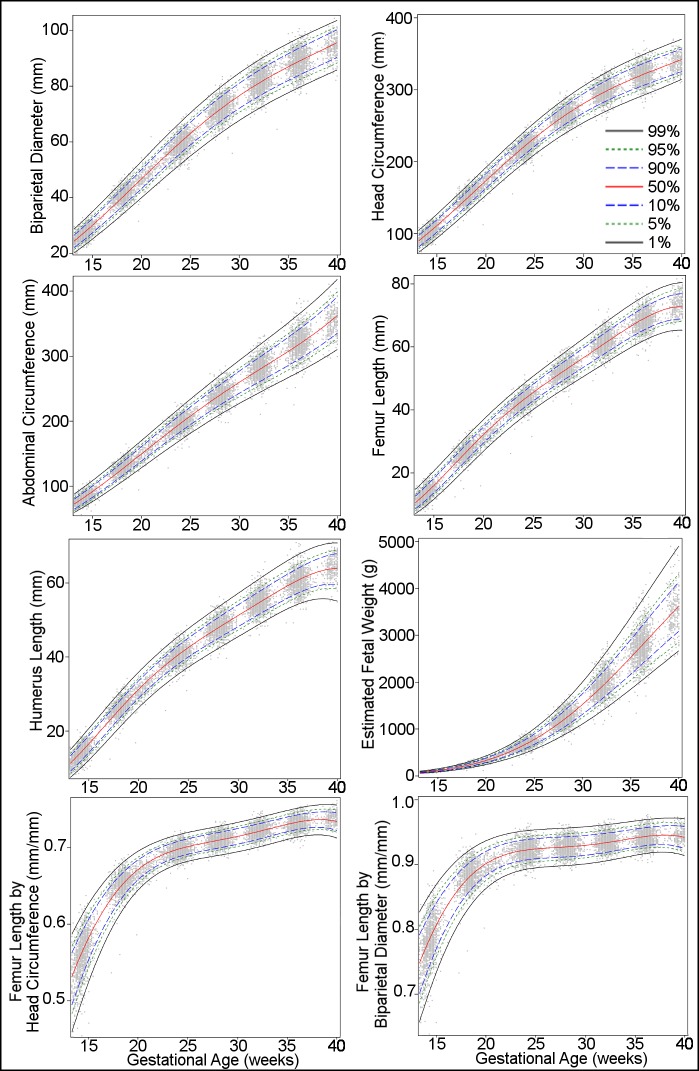
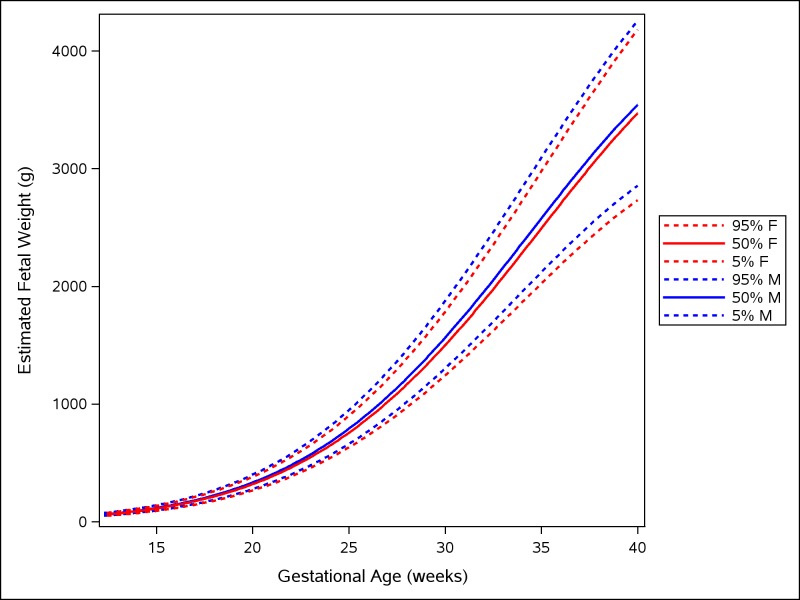
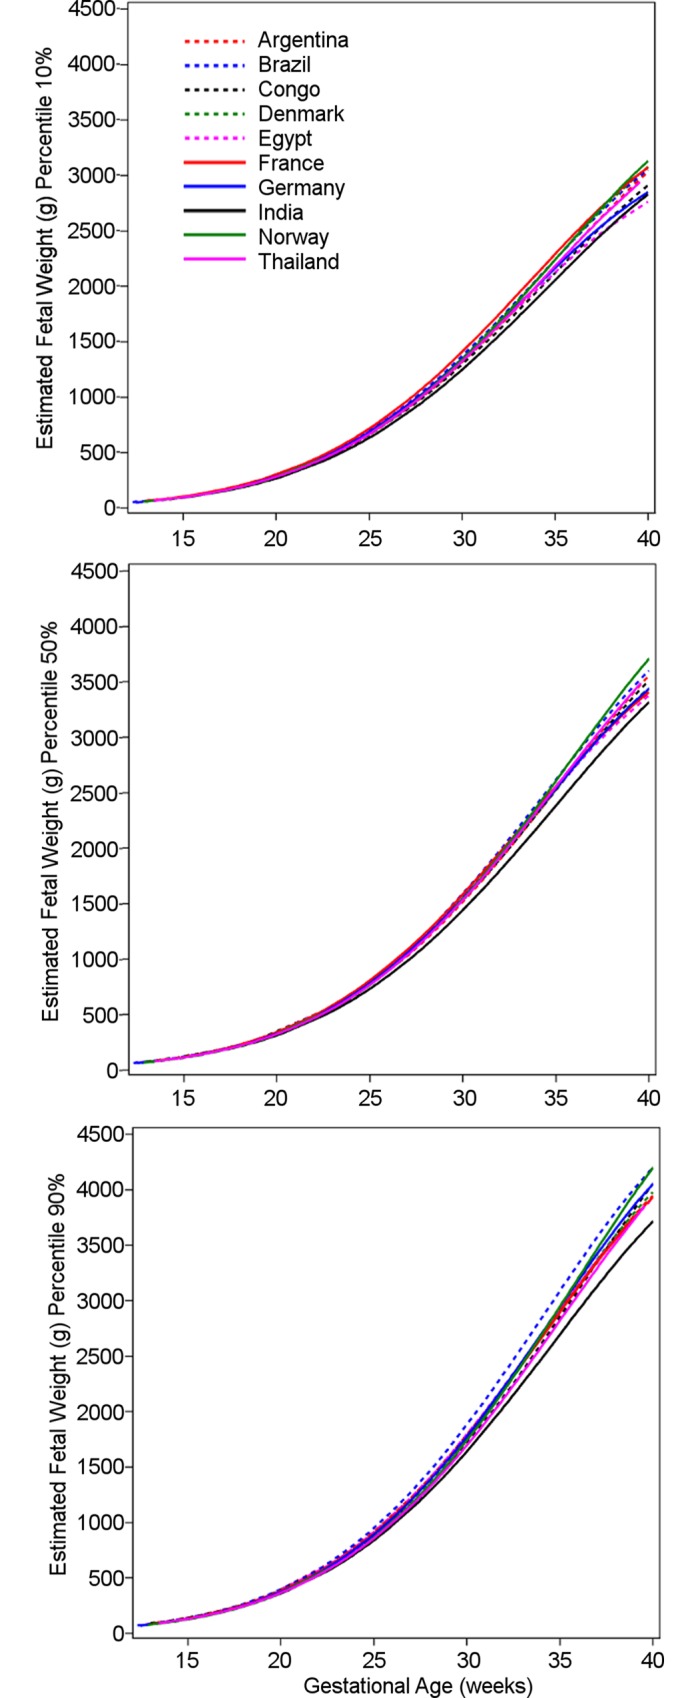
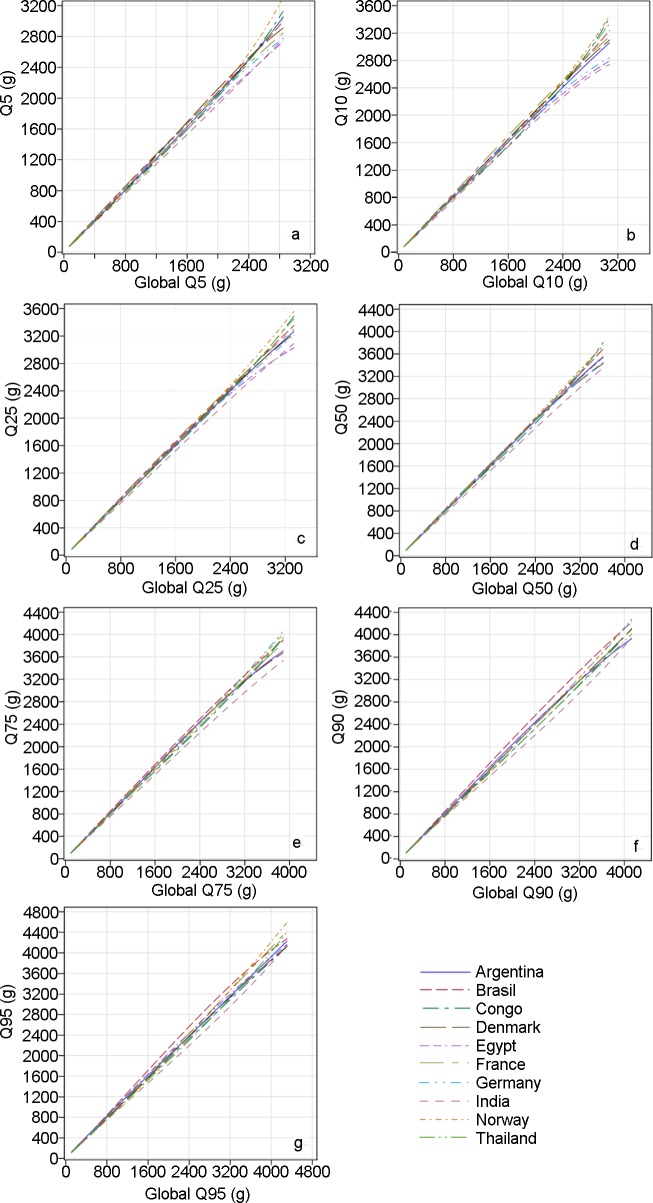
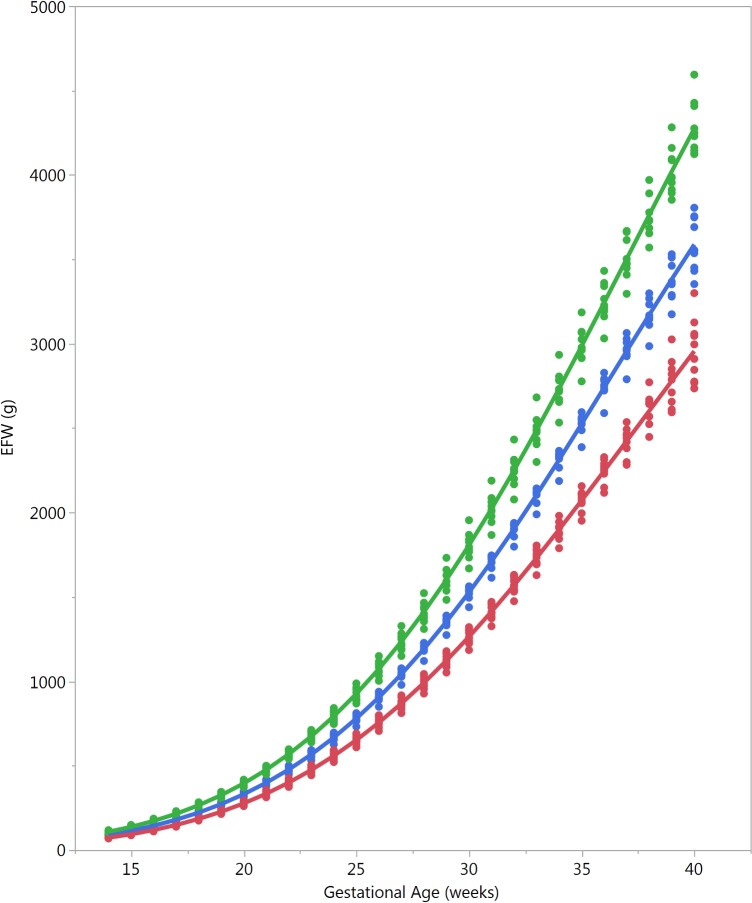
Methods and findings: We conducted a multinational prospective observational longitudinal study of fetal growth in low-risk singleton pregnancies of women of high or middle socioeconomic status and without known environmental constraints on fetal growth. Centers in ten countries (Argentina, Brazil, Democratic Republic of the Congo, Denmark, Egypt, France, Germany, India, Norway, and Thailand) recruited participants who had reliable information on last menstrual period and gestational age confirmed by crown-rump length measured at 8-13 wk of gestation. Participants had anthropometric and nutritional assessments and seven scheduled ultrasound examinations during pregnancy. Fifty-two participants withdrew consent, and 1,387 participated in the study. At study entry, median maternal age was 28 y (interquartile range [IQR] 25-31), median height was 162 cm (IQR 157-168), median weight was 61 kg (IQR 55-68), 58% of the women were nulliparous, and median daily caloric intake was 1,840 cal (IQR 1,487-2,222). The median pregnancy duration was 39 wk (IQR 38-40) although there were significant differences between countries, the largest difference being 12 d (95% CI 8-16). The median birthweight was 3,300 g (IQR 2,980-3,615). There were differences in birthweight between countries, e.g., India had significantly smaller neonates than the other countries, even after adjusting for gestational age. Thirty-one women had a miscarriage, and three fetuses had intrauterine death. The 8,203 sets of ultrasound measurements were scrutinized for outliers and leverage points, and those measurements taken at 14 to 40 wk were selected for analysis. A total of 7,924 sets of ultrasound measurements were analyzed by quantile regression to establish longitudinal reference intervals for fetal head circumference, biparietal diameter, humerus length, abdominal circumference, femur length and its ratio with head circumference and with biparietal diameter, and EFW. There was asymmetric distribution of growth of EFW: a slightly wider distribution among the lower percentiles during early weeks shifted to a notably expanded distribution of the higher percentiles in late pregnancy. Male fetuses were larger than female fetuses as measured by EFW, but the disparity was smaller in the lower quantiles of the distribution (3.5%) and larger in the upper quantiles (4.5%). Maternal age and maternal height were associated with a positive effect on EFW, particularly in the lower tail of the distribution, of the order of 2% to 3% for each additional 10 y of age of the mother and 1% to 2% for each additional 10 cm of height. Maternal weight was associated with a small positive effect on EFW, especially in the higher tail of the distribution, of the order of 1.0% to 1.5% for each additional 10 kg of bodyweight of the mother. Parous women had heavier fetuses than nulliparous women, with the disparity being greater in the lower quantiles of the distribution, of the order of 1% to 1.5%, and diminishing in the upper quantiles. There were also significant differences in growth of EFW between countries. In spite of the multinational nature of the study, sample size is a limiting factor for generalization of the charts.
Conclusions: This study provides WHO fetal growth charts for EFW and common ultrasound biometric measurements, and shows variation between different parts of the world.
Conflict of interest statement
I have read the journal's policy and the authors of this manuscript have the following competing interests: GP is a WHO statistical consultant and has a contract to give statistical support to the Fetal Growth Study. GP has worked with WHO for 15 years and has a relationship with WHO, both paid (contracts) and unpaid. GP is also a good friend of many of the investigators involved in this study. LDP is a Board Member of the Perinatal Quality Foundation, a nonprofit organization related to the Society for Maternal Fetal Medicine. LDP has received research support from General Electric Medical Systems unrelated to fetal growth. LDP also lectures 1 or 2 times per year at an educational meeting supported by General Electric Medical Systems unrelated to fetal growth.
Figures
Comment in
-
Defining Abnormal Fetal Growth and Perinatal Risk: Population or Customized Standards?PLoS Med. 2017 Jan 31;14(1):e1002229. doi: 10.1371/journal.pmed.1002229. eCollection 2017 Jan. PLoS Med. 2017. PMID: 28141844 Free PMC article.
References
-
- Department of Economic and Social Affairs of the United Nations Secretariat. The Millennium Development Goals report 2015. New York: United Nations; 2015.
-
- United Nations Foundation. Every Woman Every Child. 2016 [cited 2016 July 5]. Available from: http://www.everywomaneverychild.org/.
-
- World Health Organization. Global Health Observatory (GHO) data: neonatal mortality. Geneva: World Health Organization; 2016 [cited 2016 Dec 22]. Available from: http://www.who.int/gho/child_health/mortality/neonatal/en/.
Publication types
MeSH terms
Grants and funding
LinkOut - more resources
Full Text Sources
Other Literature Sources
Medical
Molecular Biology Databases
