

Tight Glycemic Control in Critically Ill Children
- PMID: 28118549
- PMCID: PMC5444653
- DOI: 10.1056/NEJMoa1612348
Tight Glycemic Control in Critically Ill Children
Abstract
Background: In multicenter studies, tight glycemic control targeting a normal blood glucose level has not been shown to improve outcomes in critically ill adults or children after cardiac surgery. Studies involving critically ill children who have not undergone cardiac surgery are lacking.
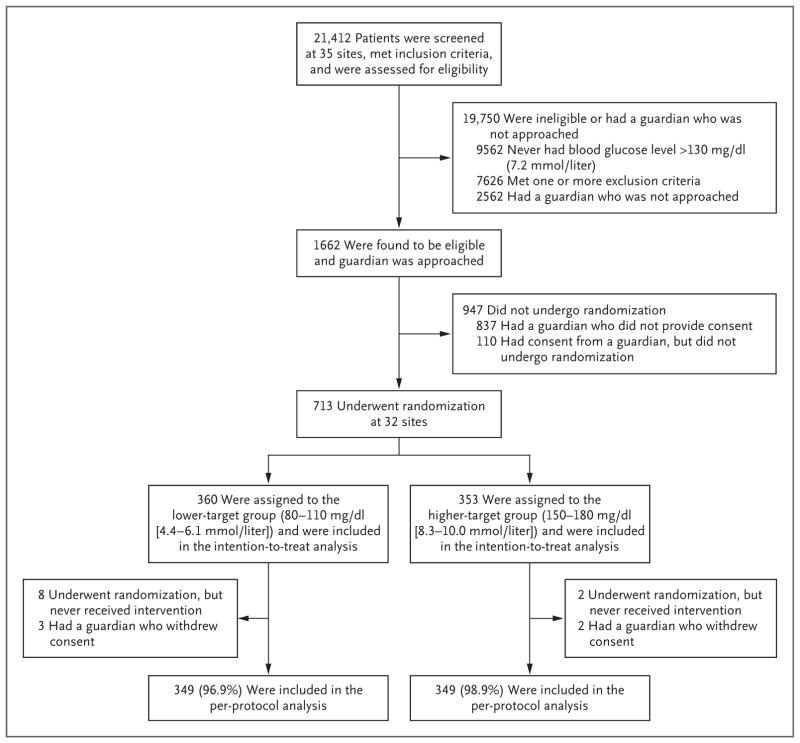
Methods: In a 35-center trial, we randomly assigned critically ill children with confirmed hyperglycemia (excluding patients who had undergone cardiac surgery) to one of two ranges of glycemic control: 80 to 110 mg per deciliter (4.4 to 6.1 mmol per liter; lower-target group) or 150 to 180 mg per deciliter (8.3 to 10.0 mmol per liter; higher-target group). Clinicians were guided by continuous glucose monitoring and explicit methods for insulin adjustment. The primary outcome was the number of intensive care unit (ICU)-free days to day 28.
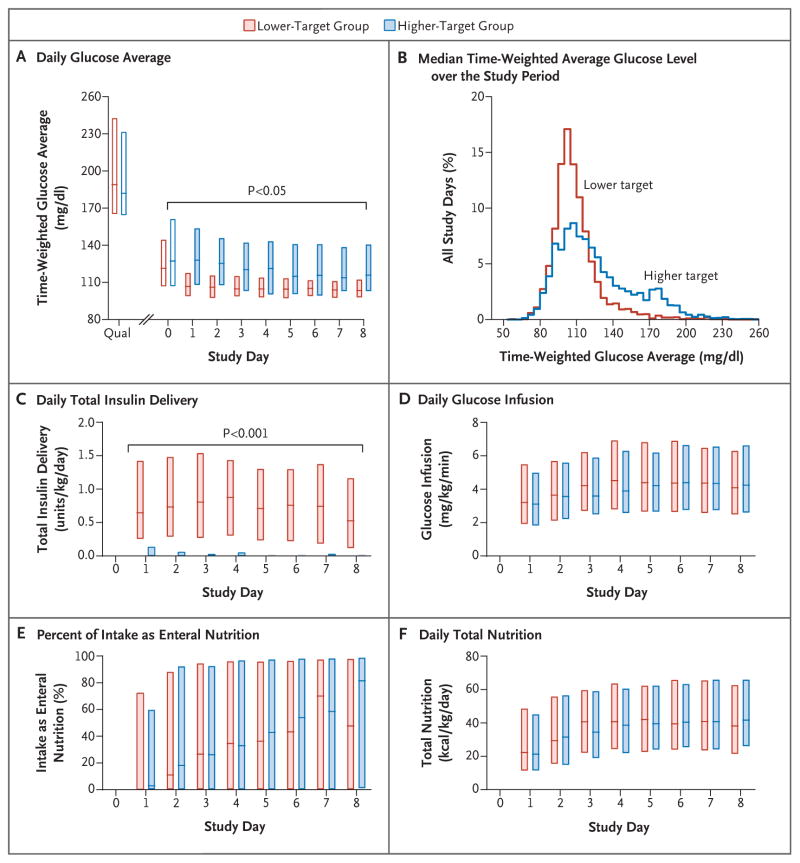
Results: The trial was stopped early, on the recommendation of the data and safety monitoring board, owing to a low likelihood of benefit and evidence of the possibility of harm. Of 713 patients, 360 were randomly assigned to the lower-target group and 353 to the higher-target group. In the intention-to-treat analysis, the median number of ICU-free days did not differ significantly between the lower-target group and the higher-target group (19.4 days [interquartile range {IQR}, 0 to 24.2] and 19.4 days [IQR, 6.7 to 23.9], respectively; P=0.58). In per-protocol analyses, the median time-weighted average glucose level was significantly lower in the lower-target group (109 mg per deciliter [IQR, 102 to 118]; 6.1 mmol per liter [IQR, 5.7 to 6.6]) than in the higher-target group (123 mg per deciliter [IQR, 108 to 142]; 6.8 mmol per liter [IQR, 6.0 to 7.9]; P<0.001). Patients in the lower-target group also had higher rates of health care-associated infections than those in the higher-target group (12 of 349 patients [3.4%] vs. 4 of 349 [1.1%], P=0.04), as well as higher rates of severe hypoglycemia, defined as a blood glucose level below 40 mg per deciliter (2.2 mmol per liter) (18 patients [5.2%] vs. 7 [2.0%], P=0.03). No significant differences were observed in mortality, severity of organ dysfunction, or the number of ventilator-free days.
Conclusions: Critically ill children with hyperglycemia did not benefit from tight glycemic control targeted to a blood glucose level of 80 to 110 mg per deciliter, as compared with a level of 150 to 180 mg per deciliter. (Funded by the National Heart, Lung, and Blood Institute and others; HALF-PINT ClinicalTrials.gov number, NCT01565941 .).
Figures
Comment in
-
Paediatric endocrinology: Critical illness - another trial, but are we any wiser?Nat Rev Endocrinol. 2017 May;13(5):254-256. doi: 10.1038/nrendo.2017.29. Epub 2017 Mar 17. Nat Rev Endocrinol. 2017. PMID: 28304391 No abstract available.
-
Critically ill children did not benefit from tight glycaemic control.Arch Dis Child Educ Pract Ed. 2017 Dec;102(6):336. doi: 10.1136/archdischild-2017-313012. Epub 2017 May 23. Arch Dis Child Educ Pract Ed. 2017. PMID: 28536138 No abstract available.
-
Tight Glycemic Control in Critically Ill Children.N Engl J Med. 2017 Jun 8;376(23):e48. doi: 10.1056/NEJMc1703642. N Engl J Med. 2017. PMID: 28594154 No abstract available.
-
Tight glycemic control may be harmful in hyperglycemic, critically ill children.J Pediatr. 2017 Jul;186:209-212. doi: 10.1016/j.jpeds.2017.04.022. J Pediatr. 2017. PMID: 28648274 No abstract available.
References
-
- Van den Berghe G, Wouters P, Weekers F, et al. Intensive insulin therapy in critically ill patients. N Engl J Med. 2001;345:1359–67. - PubMed
-
- The NICE-SUGAR Study Investigators. Intensive versus conventional glucose control in critically ill patients. N Engl J Med. 2009;360:1283–97. - PubMed
-
- The NICE-SUGAR Study Investigators. Hypoglycemia and risk of death in critically ill patients. N Engl J Med. 2012;367:1108–18. - PubMed
-
- Preiser JC, Devos P, Ruiz-Santana S, et al. A prospective randomised multicentre controlled trial on tight glucose control by intensive insulin therapy in adult intensive care units: the Glucontrol study. Intensive Care Med. 2009;35:1738–48. - PubMed
-
- Vlasselaers D, Milants I, Desmet L, et al. Intensive insulin therapy for patients in paediatric intensive care: a prospective, randomised controlled study. Lancet. 2009;373:547–56. - PubMed
Publication types
MeSH terms
Substances
Associated data
Grants and funding
LinkOut - more resources
Full Text Sources
Other Literature Sources
Medical