On the cytokine/chemokine network during Plasmodium vivax malaria: new insights to understand the disease
- PMID: 28118834
- PMCID: PMC5260126
- DOI: 10.1186/s12936-017-1683-5
On the cytokine/chemokine network during Plasmodium vivax malaria: new insights to understand the disease
Abstract
Background: The clinical outcome of malaria depends on the delicate balance between pro-inflammatory and immunomodulatory cytokine responses triggered during infection. Despite the numerous reports on characterization of plasma levels of cytokines/chemokines, there is no consensus on the profile of these mediators during blood stage malaria. The identification of acute phase biomarkers might contribute to a better understanding of the disease, allowing the use of more effective therapeutic approaches to prevent the progression towards severe disease. In the present study, the plasma levels of cytokines and chemokines and their association with parasitaemia and number of previous malaria episodes were evaluated in Plasmodium vivax-infected patients during acute and convalescence phase, as well as in healthy donors.
Methods: Samples of plasma were obtained from peripheral blood samples from four different groups: P. vivax-infected, P. vivax-treated, endemic control and malaria-naïve control. The cytokine (IL-6, IL-10, IL-17, IL-27, TGF-β, IFN-γ and TNF) and chemokine (MCP-1/CCL2, IP-10/CXCL10 and RANTES/CCL5) plasma levels were measured by CBA or ELISA. The network analysis was performed using Spearman correlation coefficient.
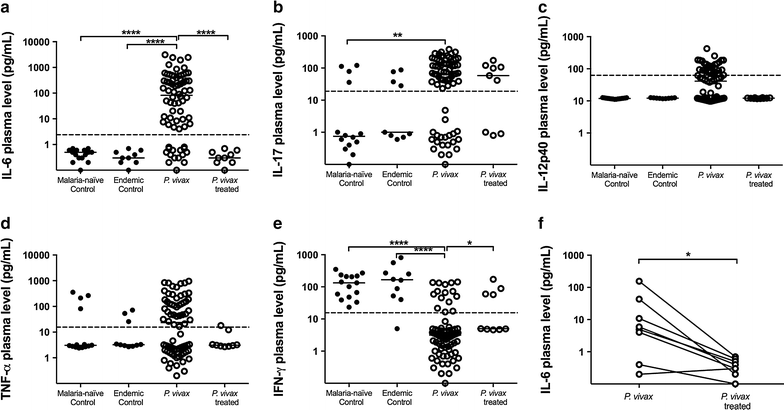
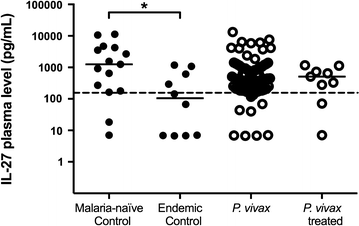
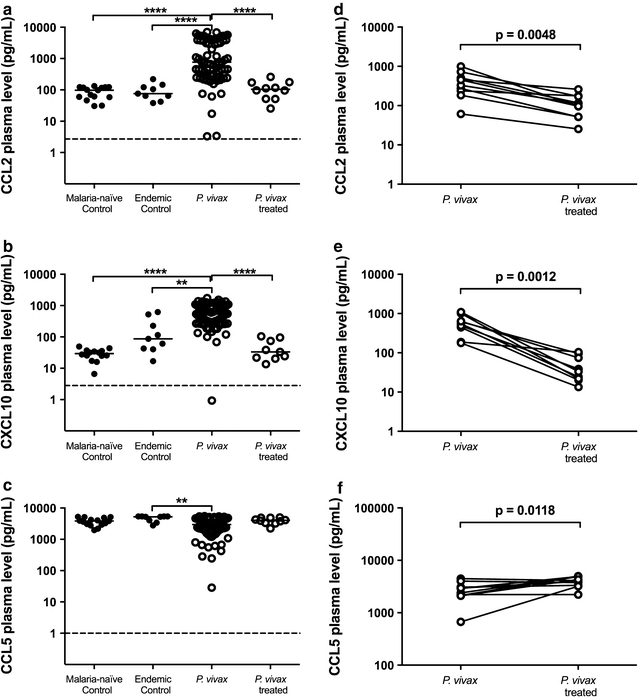
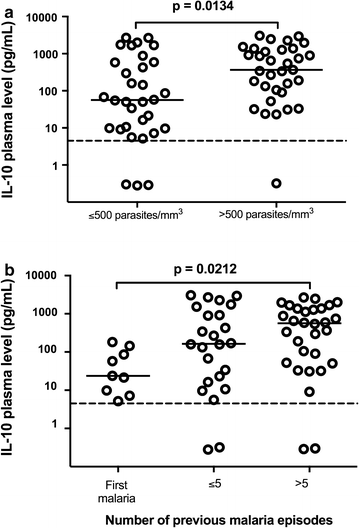
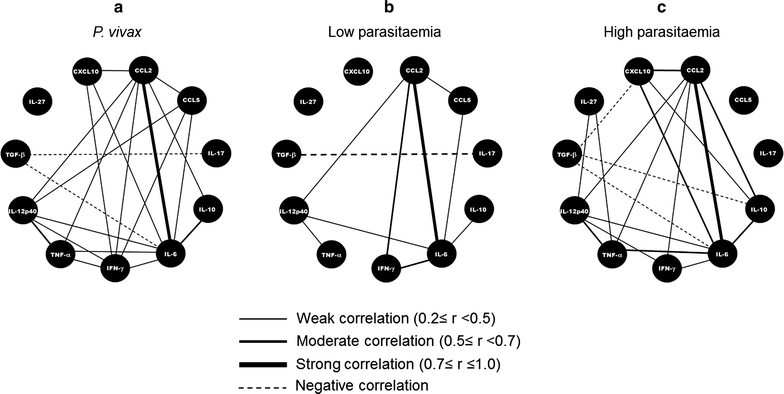
Results: Plasmodium vivax infection induced a pro-inflammatory response driven by IL-6 and IL-17 associated with an immunomodulatory profile mediated by IL-10 and TGF-β. In addition, a reduction was observed of IFN-γ plasma levels in P. vivax group. A lower level of IL-27 was observed in endemic control group in comparison to malaria-naïve control group. No significant results were found for IL-12p40 and TNF. It was also observed that P. vivax infection promoted higher levels of MCP-1/CCL2 and IP-10/CXCL10 and lower levels of RANTES/CCL5. The plasma level of IL-10 was elevated in patients with high parasitaemia and with more than five previous malaria episodes. Furthermore, association profile between cytokine and chemokine levels were observed by correlation network analysis indicating signature patterns associated with different parasitaemia levels.
Conclusions: The P. vivax infection triggers a balanced immune response mediated by IL-6 and MCP-1/CCL2, which is modulated by IL-10. In addition, the results indicated that IL-10 plasma levels are influenced by parasitaemia and number of previous malaria episodes.
Keywords: Chemokines; Cytokines; Malaria; Plasmodium vivax.
Figures

Similar articles
-
Analysis of the lymphocyte cell population during malaria caused by Plasmodium vivax and its correlation with parasitaemia and thrombocytopaenia.Malar J. 2018 Aug 20;17(1):303. doi: 10.1186/s12936-018-2443-x. Malar J. 2018. PMID: 30126413 Free PMC article.
-
A preliminary study on pro- and anti-inflammatory cytokine profiles in Plasmodium vivax malaria patients from central zone of India.Acta Trop. 2010 Mar;113(3):263-8. doi: 10.1016/j.actatropica.2009.11.009. Epub 2009 Dec 1. Acta Trop. 2010. PMID: 19958746
-
Polymorphisms in Plasmodium vivax Circumsporozoite Protein (CSP) Influence Parasite Burden and Cytokine Balance in a Pre-Amazon Endemic Area from Brazil.PLoS Negl Trop Dis. 2016 Mar 4;10(3):e0004479. doi: 10.1371/journal.pntd.0004479. eCollection 2016 Mar. PLoS Negl Trop Dis. 2016. PMID: 26943639 Free PMC article.
-
The paroxysm of Plasmodium vivax malaria.Trends Parasitol. 2003 Apr;19(4):188-93. doi: 10.1016/s1471-4922(03)00036-9. Trends Parasitol. 2003. PMID: 12689650 Review.
-
Association between RANTES/CCL5 levels with Plasmodium infections and malaria severity: a systematic review.Malar J. 2024 Nov 9;23(1):335. doi: 10.1186/s12936-024-05152-1. Malar J. 2024. PMID: 39521981 Free PMC article.
Cited by
-
Vivax Malaria and the Potential Role of the Subtelomeric Multigene vir Superfamily.Microorganisms. 2022 May 24;10(6):1083. doi: 10.3390/microorganisms10061083. Microorganisms. 2022. PMID: 35744600 Free PMC article. Review.
-
Dissecting disease tolerance in Plasmodium vivax malaria using the systemic degree of inflammatory perturbation.PLoS Negl Trop Dis. 2021 Nov 2;15(11):e0009886. doi: 10.1371/journal.pntd.0009886. eCollection 2021 Nov. PLoS Negl Trop Dis. 2021. PMID: 34727121 Free PMC article.
-
Morphological and Transcriptional Changes in Human Bone Marrow During Natural Plasmodium vivax Malaria Infections.J Infect Dis. 2022 Apr 1;225(7):1274-1283. doi: 10.1093/infdis/jiaa177. J Infect Dis. 2022. PMID: 32556188 Free PMC article.
-
Genetic Diversity of Human Host Genes Involved in Immune Response and the Binding of Malaria Parasite in Patients Residing along the Thai-Myanmar border.Trop Med Infect Dis. 2021 Sep 24;6(4):174. doi: 10.3390/tropicalmed6040174. Trop Med Infect Dis. 2021. PMID: 34698295 Free PMC article.
-
Cerebral Malaria Model Applying Human Brain Organoids.Cells. 2023 Mar 23;12(7):984. doi: 10.3390/cells12070984. Cells. 2023. PMID: 37048057 Free PMC article.
References
-
- WHO. World malaria report 2014. Geneva: World Health Organization; 2014. http://www.who.int/malaria/publications/world_malaria_report_2014/en/. Accessed 15 Nov 2014.
Publication types
MeSH terms
Substances
LinkOut - more resources
Full Text Sources
Other Literature Sources
Miscellaneous

