. 2017 Jan 24;18(1):15.
doi: 10.1186/s13059-016-1133-7.

Single-cell epigenomic variability reveals functional cancer heterogeneity

Affiliations

Single-cell epigenomic variability reveals functional cancer heterogeneity

Ulrike M Litzenburger et al. Genome Biol. .

Abstract

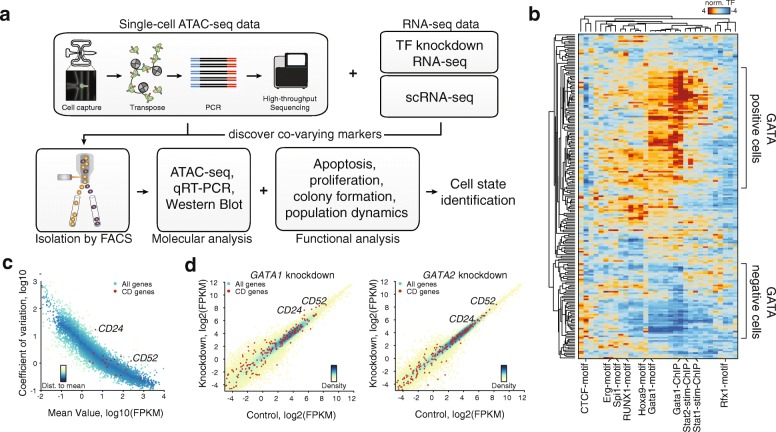
Background: Cell-to-cell heterogeneity is a major driver of cancer evolution, progression, and emergence of drug resistance. Epigenomic variation at the single-cell level can rapidly create cancer heterogeneity but is difficult to detect and assess functionally.

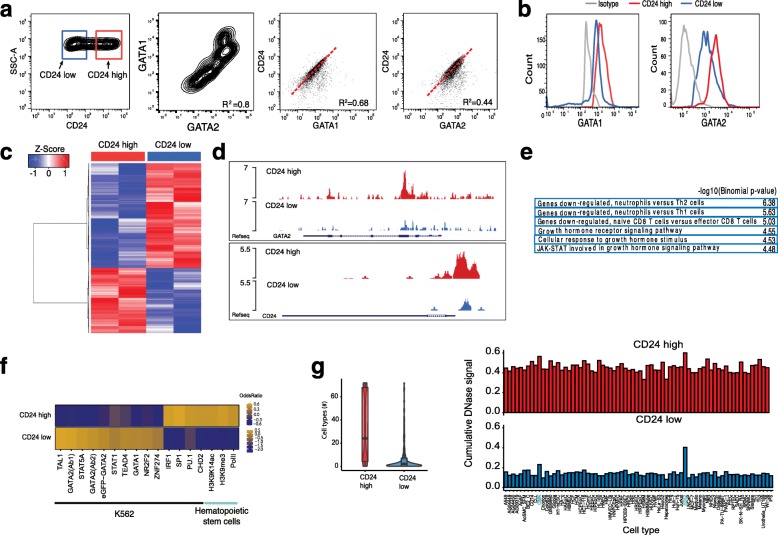
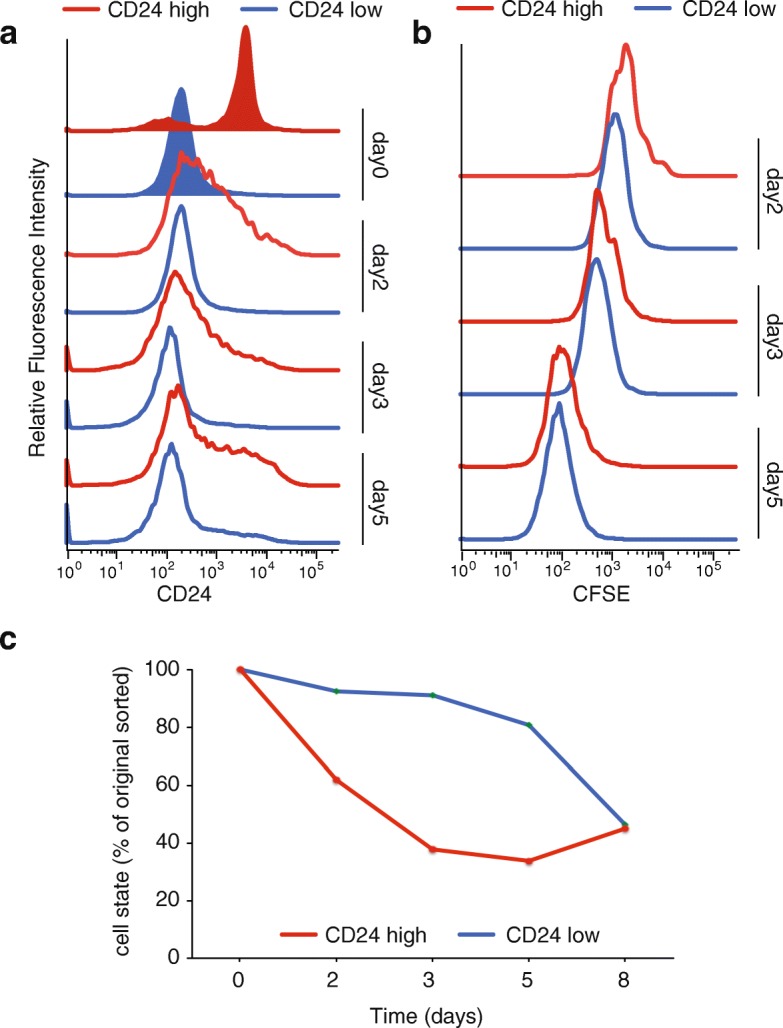
Results: We develop a strategy to bridge the gap between measurement and function in single-cell epigenomics. Using single-cell chromatin accessibility and RNA-seq data in K562 leukemic cells, we identify the cell surface marker CD24 as co-varying with chromatin accessibility changes linked to GATA transcription factors in single cells. Fluorescence-activated cell sorting of CD24 high versus low cells prospectively isolated GATA1 and GATA2 high versus low cells. GATA high versus low cells express differential gene regulatory networks, differential sensitivity to the drug imatinib mesylate, and differential self-renewal capacity. Lineage tracing experiments show that GATA/CD24hi cells have the capability to rapidly reconstitute the heterogeneity within the entire starting population, suggesting that GATA expression levels drive a phenotypically relevant source of epigenomic plasticity.

Conclusion: Single-cell chromatin accessibility can guide prospective characterization of cancer heterogeneity. Epigenomic subpopulations in cancer impact drug sensitivity and the clonal dynamics of cancer evolution.

Keywords: Cancer stem cells; Gene expression noise; Open chromatin.


Figures

Fig. 1
Fig. 1
Strategy for identifying a cell surface marker co-varying with identified varying transcription factors. a Cartoon illustrating the strategy: single-cell ATAC-seq is followed by sequencing and analysis of cell-to-cell variation, focusing on transcription factor (TF) motifs. RNA-seq and single-cell RNA-seq data are used to correlate cell surface expression with expression of the transcription factor with highest identified variability. The expression of the cell surface protein is subsequently used to isolate subpopulations, which can then be analyzed for molecular and functional characteristics. b Hierarchical clustering of cells (rows) and high-variance transcription factors (columns). Scores represent relative accessibility and are reproduced from Buenrostro et al. [19]. c Single-cell RNA-seq data of K562 cells. Coefficient of variation is plotted against the mean FPKM, data points are colored by distance to running mean. Red dots indicate CD expression markers. d Re-analysis of RNA-seq data of GATA1 and GATA2 knockdown in K562 cells. Control FPKM is plotted against knockdown FPKM; data points are colored by density. Red dots indicate CD expression markers. FACS fluorescence-activated cell sorting, qRT-PCR quantitative reverse transcription PCR
Fig. 2
Fig. 2
Molecular characteristics of identified subpopulations. a Flow cytometric analysis of K562 cells for CD24, GATA1, and GATA2. Right panels: CD24 correlates with GATA1 (R2 = 0.68) and GATA2 (R2 = 0.44). b Representative histogram FACS plots of the re-analysis of K562 cells for GATA1 (left) and GATA2 (right) after sorting for CD24. CD24hi sorted population is labeled red, CD24lo sorted population is labeled blue, isotype control gray. Mean fluorescent intensity (MFI) 2565 for GATA1 high, 2098 for GATA1 low, 2930 for GATA2 high, and 2457 for GATA2 low. c ATAC-seq of CD24hi and CD24lo sorted K562 cells (replicates); 2757 peaks are differentially regulated with a fold change of 1.5 and p value <0.001. Blue represents genomic locations less accessible, red locations with higher accessibility compared to the mean of all samples. d Representative UCSC genome browser tracks of open chromatin regions in K562 CD24hi sorted cells (upper track, red) and K562 CD24lo sorted cells (lower track, blue). Example regions shown are the GATA2 and CD24 locus. e Gene Ontology term analysis of chromosomal regions, which are more accessible in the CD24hi population. f Enrichment of ATAC-seq peaks more open in CD24hi (top) or CD24lo (bottom) in K562 and hematopoietic stem cell ChIP-seq datasets. Shown are odds ratios calculated using Fisher’s exact test. Values below zero demonstrate de-enrichment (blue) and above zero enrichment (orange). g Overlap of ATAC-seq peaks more accessible in CD24hi (red) or CD24lo (blue) with DNAse peaks across 72 different cell types. Left: Number of cell types with overlap is quantified. Right: The different cell types are shown; K562 and CMK leukemia cell lines are highlighted in green
Fig. 3
Fig. 3
Functional characteristics of identified subpopulations. a Proliferation measured by EdU incorporation by K562 cells treated with 1 μM imatinib or DMSO control for 24 h. Upper panel (blue) shows CD24lo sorted cells, lower panel (red) shows CD24hi sorted cells. Experiments were performed in triplicate. b Annexin–propium iodide FACS of K562 cells treated with 1 μM imatinib or DMSO control for 24 h. Upper panel shows CD24lo sorted cells, lower panel shows CD24hi sorted cells. Experiments were performed in triplicate. c Colony formation assay of CD24hi and CD24lo K562 cells for 5 days. Left: representative microscopy pictures of the colonies formed: CD24lo upper panel, CD24hi lower panel. Right: Quantification of colonies formed. Blue indicates CD24lo, red CD24hi sorted K562. Experiments were performed in triplicate, error bars represent standard error, and asterisks indicate significant difference with p value <0.01
Fig. 4
Fig. 4
Epigenomic plasticity of K562 subpopulations. a FACS analysis of CD24 sorted K562 cells. Shown are the initial sort (tinted) and the flow cytometric re-analysis at days 2, 3, and 5. Blue indicates CD24lo sorted K562 cells, red CD24hi sorted population. b Proliferation analysis of K562 sorted subpopulations. After the initial sort CD24hi and CD24lo cells were stained with CFSE and then cultured for 8 days. CFSE fluorescence intensity was measured at days 2, 3, and 5 together with CD24 (a). c Quantification of the changes in CD24-expressing cells. Blue, CD24lo; red, CD24hi

Similar articles

Cited by

References

    1. Buffo A, Rite I, Tripathi P, Lepier A, Colak D, Horn AP, et al. Origin and progeny of reactive gliosis: a source of multipotent cells in the injured brain. Proc Natl Acad Sci U S A. 2008;105(9):3581–6. doi: 10.1073/pnas.0709002105. - DOI - PMC - PubMed
    1. Sirko S, Behrendt G, Johansson PA, Tripathi P, Costa M, Bek S, et al. Reactive glia in the injured brain acquire stem cell properties in response to sonic hedgehog. [corrected] Cell Stem Cell. 2013;12(4):426–39. doi: 10.1016/j.stem.2013.01.019. - DOI - PubMed
    1. Friedmann-Morvinski D, Verma IM. Dedifferentiation and reprogramming: origins of cancer stem cells. EMBO Rep. 2014;15(3):244–53. doi: 10.1002/embr.201338254. - DOI - PMC - PubMed
    1. Micalizzi DS, Farabaugh SM, Ford HL. Epithelial-mesenchymal transition in cancer: parallels between normal development and tumor progression. J Mammary Gland Biol Neoplasia. 2010;15(2):117–34. doi: 10.1007/s10911-010-9178-9. - DOI - PMC - PubMed
    1. Barski A, Cuddapah S, Cui K, Roh TY, Schones DE, Wang Z, et al. High-resolution profiling of histone methylations in the human genome. Cell. 2007;129(4):823–37. doi: 10.1016/j.cell.2007.05.009. - DOI - PubMed

Publication types