. 2017 Apr;15(4):405-417.
doi: 10.1158/1541-7786.MCR-16-0242-T. Epub 2017 Jan 23.

EZH2 or HDAC1 Inhibition Reverses Multiple Myeloma-Induced Epigenetic Suppression of Osteoblast Differentiation

Affiliations

EZH2 or HDAC1 Inhibition Reverses Multiple Myeloma-Induced Epigenetic Suppression of Osteoblast Differentiation

Juraj Adamik et al. Mol Cancer Res. 2017 Apr.

Abstract

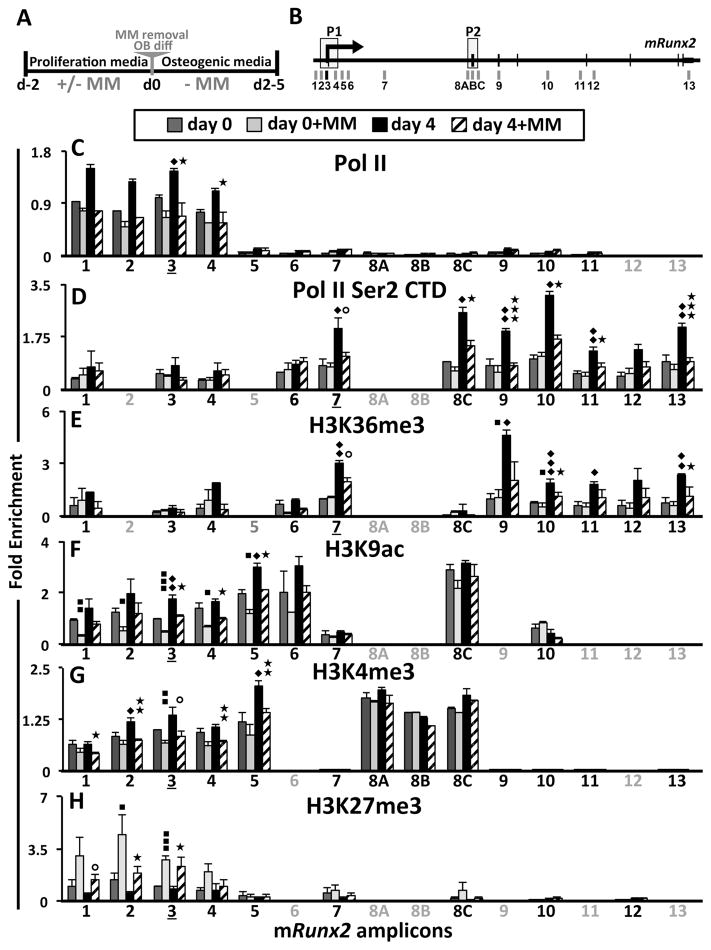
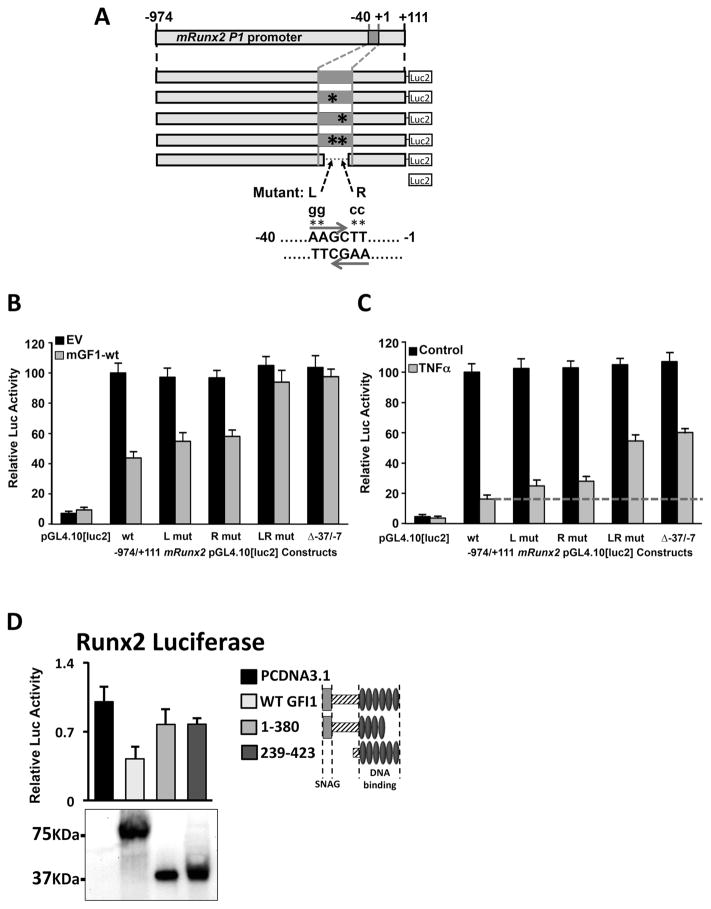
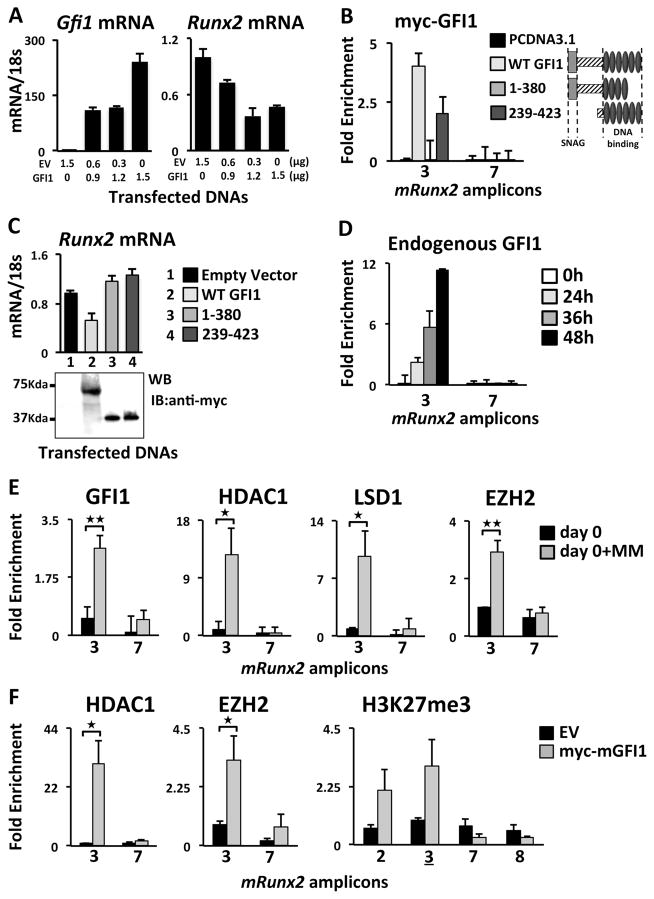
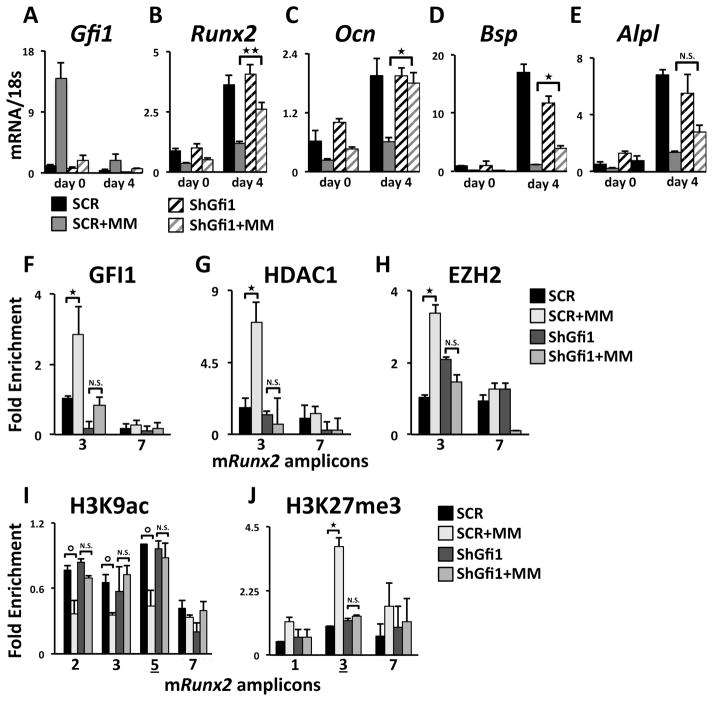
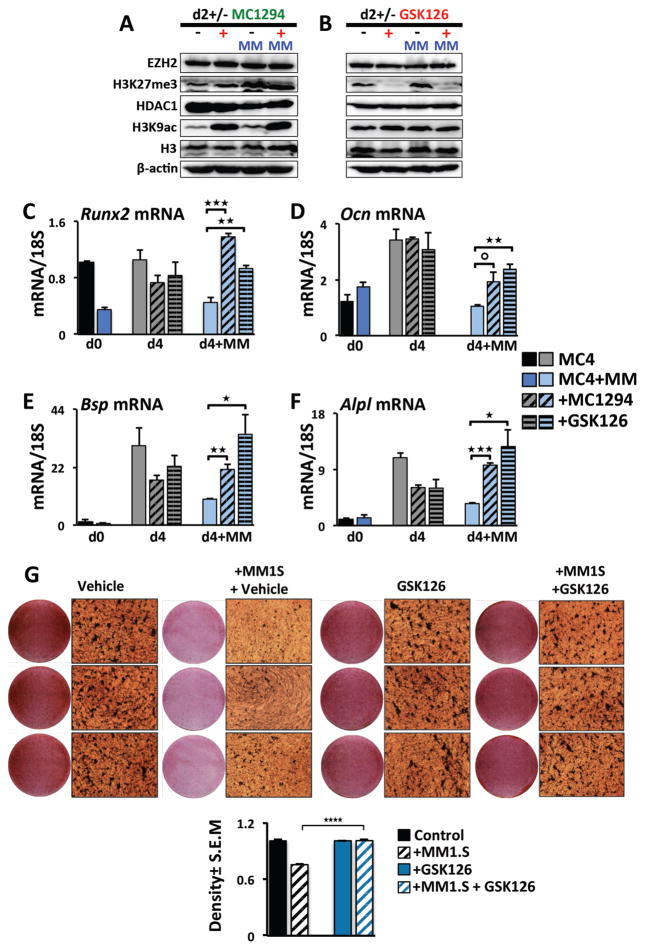
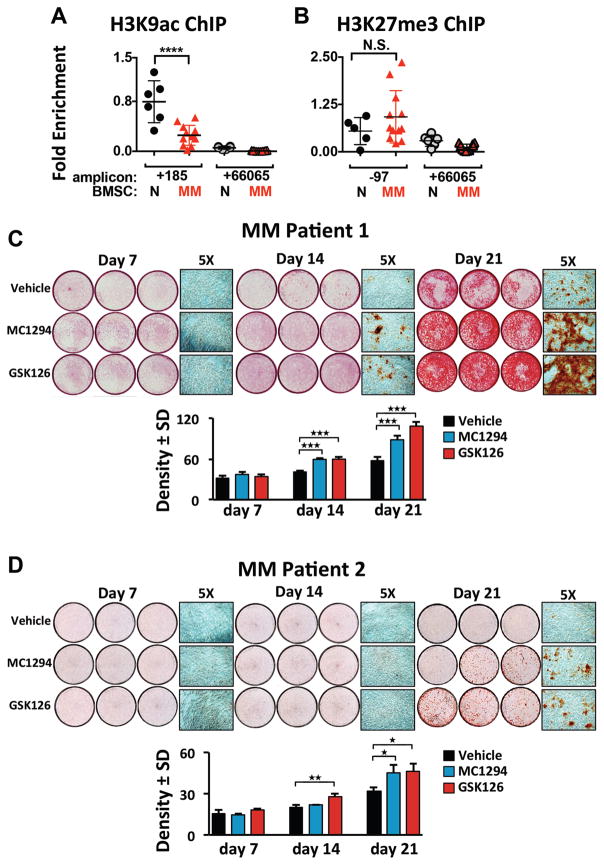
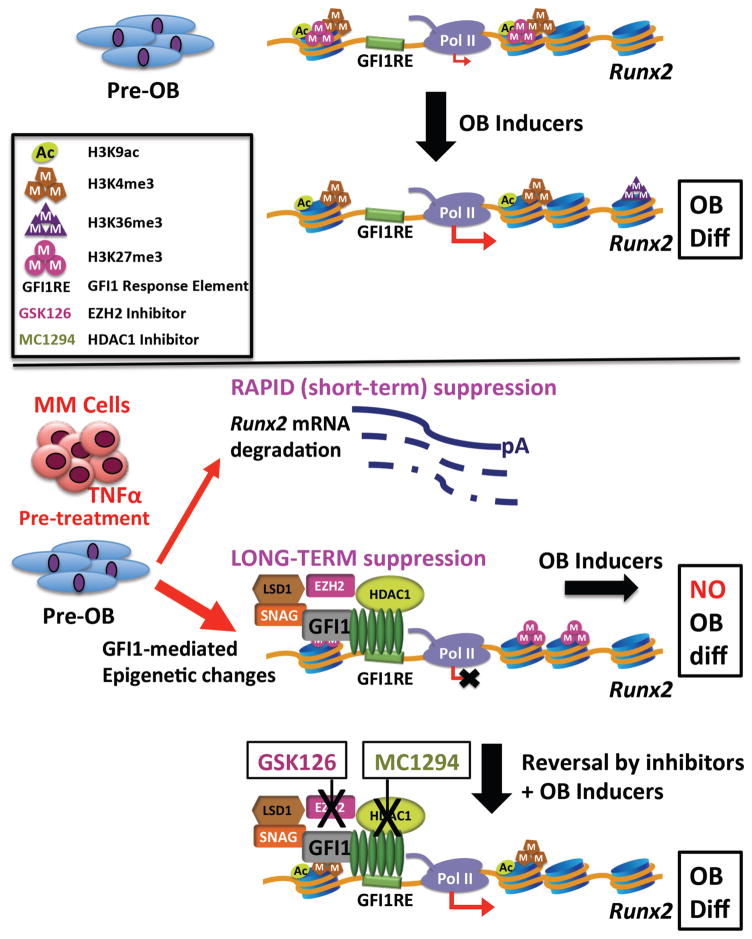
In multiple myeloma, osteolytic lesions rarely heal because of persistent suppressed osteoblast differentiation resulting in a high fracture risk. Herein, chromatin immunoprecipitation analyses reveal that multiple myeloma cells induce repressive epigenetic histone changes at the Runx2 locus that prevent osteoblast differentiation. The most pronounced multiple myeloma-induced changes were at the Runx2-P1 promoter, converting it from a poised bivalent state to a repressed state. Previously, it was observed that multiple myeloma induces the transcription repressor GFI1 in osteoblast precursors, which correlates with decreased Runx2 expression, thus prompting detailed characterization of the multiple myeloma and TNFα-dependent GFI1 response element within the Runx2-P1 promoter. Further analyses reveal that multiple myeloma-induced GFI1 binding to Runx2 in osteoblast precursors and recruitment of the histone modifiers HDAC1, LSD1, and EZH2 is required to establish and maintain Runx2 repression in osteogenic conditions. These GFI1-mediated repressive chromatin changes persist even after removal of multiple myeloma. Ectopic GFI1 is sufficient to bind to Runx2, recruit HDAC1 and EZH2, increase H3K27me3 on the gene, and prevent osteogenic induction of endogenous Runx2 expression. Gfi1 knockdown in MC4 cells blocked multiple myeloma-induced recruitment of HDAC1 and EZH2 to Runx2, acquisition of repressive chromatin architecture, and suppression of osteoblast differentiation. Importantly, inhibition of EZH2 or HDAC1 activity in pre-osteoblasts after multiple myeloma exposure in vitro or in osteoblast precursors from patients with multiple myeloma reversed the repressive chromatin architecture at Runx2 and rescued osteoblast differentiation.Implications: This study suggests that therapeutically targeting EZH2 or HDAC1 activity may reverse the profound multiple myeloma-induced osteoblast suppression and allow repair of the lytic lesions. Mol Cancer Res; 15(4); 405-17. ©2017 AACR.


Conflict of interest statement

Conflict of Interest: GDR participates on an advisory board for Amgen. The other authors have declared that no conflict of interest exists.

Figures

Figure 1
Figure 1. Transcriptional and epigenetic changes at mRunx2 in MM-exposed MC4
(A) Experimental design schematic of 5TGM1 MM-MC4 co-cultures and induction of OB differentiation. After 48 h co-culture in proliferation media, the MM cells were removed, and the MC4 were either harvested immediately (d0±MM) or first placed in OB differentiation media for 4 days (d4±MM). (B) Schematic of mRunx2 qPCR amplicons with promoters P1 and P2 indicated (see Table S2 for positional numbering and the primer sequences). Amplicon-3 encompasses the Gfi1 binding site. (CH) ChIP-qPCR analyses of RNA Pol II occupancy and several H3 modifications along mRunx2 in MC4 cells treated as described in A using qPCR amplicons denoted in B (amplicons not done for a particular pull-down are in gray). Enrichment values are plotted relative to amplicons 3 or 7 as indicated by underlining, depending upon whether the focus was on the promoter (C, FH) or the body of the gene (D, E): (C) total RNA Pol II; (D) phosphorylated Pol II CTD Ser 2P; (E) elongation mark H3K36me3; (F) activation mark H3K9ac; (G) activation mark H3K4me3; and (H) repressive mark H3K27me3. Error bars represent SEM of 3–4 biological replicates (2 replicates for H3K9ac d4±MM). Statistically significant comparisons of: ◆;d4-MM to d0-MM, ■; d0+MM to d0-MM; ★; d4+MM to d4-MM. ⭘ – represents values of p<0.08.
Figure 2
Figure 2. Mutation of the GFI1 cores at -21/-16 mRunx2 relieves ectopic GFI1 and TNFα repression of the Runx2 promoter
Reporters -974/+111 mRunx2 promoter-pGL4.10[luc2] WT or containing mutations L, R, or LR or the internal deletion Δ-37/-7 (depicted in A) were transfected into MC4 cells either (B) with pcDNA3.1 (EV) and pcDNA3.1-mGFI1-WT plasmids or (C) that were treated with nothing (Control) or TNFα (0.5 ng/ml) 6 h after transfection. (B, C) Reported luciferase activities in harvested (48 h) cell lysates were evaluated with respect to WT reporter either (B) cotransfected with EV or (C) the untreated control. (D) Myc-mGFI1-WT, deletion constructs which encode mGfi1 aa 1-380 or 239-423, and EV were cotransfected into MC4 cells with mRunx2-Luc-WT reporter depicted in A, and harvested lysates were analyzed for luciferase activities as compared to cells transfected with EV and myc-GFI1 expression by Western Blot (shown below graph). Each experiment above was repeated at least three independent times.
Figure 3
Figure 3. Analysis of recruitment to mRunx2 of histone modifier enzymes in MM-exposed or GFI1-transfected MC4
(A) Varying amounts of mGFI1-WT and EV plasmids transfected as indicated into MC4 cells and mGfi1 and endogenous mRunx2 mRNA levels were evaluated by qPCR. (B,C) Myc-mGFI1-WT, myc-mGFI1 deletion constructs encoding aa 1-380 or 239-423, or EV were transfected into MC4. Transfected cells were analyzed for (B) myc-mGFI1 binding at the Runx2 promoter amplicon-3 by ChIP-qPCR using anti-myc Ab and (C) the effect on endogenous Runx2 mRNA levels by qPCR with expression of the transfected myc-mGFI1s by Western Blot displayed underneath. (D) ChIP-qPCR analysis of endogenous GFI1 recruitment to the Runx2 promoter amplicon-3 (Fig 1B) in MC4 cells co-cultured with 5TGM1 MM cells for the indicated times. For all, biological triplicates within two separately run experiments were averaged together and the SEM calculated. (E) ChIP-qPCR analyses of MC4 cells after MM-exposure per scheme in Fig. 1A (d0±MM) for GFI1 binding and HDAC1, LSD1, and EZH2 occupancy within the mRunx2 amplicon-3. (F) ChIP-qPCR analyses of ectopic GFI1 recruitment of HDAC1 and EZH2, and consequent enhancement of H3K27me3 at the Runx2 promoter in MC4. Error bars represent SEM for 3 biological replicates except H3K27me3 in F had only two. (B, D–F) Amplicon-7 was used as a negative control for GFI1 binding.
Figure 4
Figure 4. mGfi1 knockdown in MC4 cells prevents MM-induced repression of mRunx2 and OB differentiation markers, the recruitment of HDAC1 and EZH2, and repressed chromatin architecture acquisition
qPCR analysis of mRNAs from SCR- and shGfi1-MC4 cells treated as described in Fig. 1A for: (A) Gfi1, (B) Runx2, (C) Ocn, (D) Bsp, and (E) Alpl mRNA expression. ChIP-qPCR analyses of MM-induced recruitment to the Runx2 promoter of (F) GFI1, (G) HDAC1, and (H) EZH2 and enrichment profiles for (I) H3K9ac and (J) H3K27me3 in SCR and shGfi1-MC4 at d0±MM. IgG ChIP was run on SCR-MC4 cells. Error bars represent SEM for (AE) 3–4 or (FJ) 2 biological replicates ⭘ – represents values of p<0.08. Amplicons as indicated in Fig 1B.
Figure 5
Figure 5. Inhibition of histone modifiers HDAC1 and EZH2 rescues OB differentiation of MM-exposed MC4 cultures
(AF) MC4 cells were exposed to 5TGM1 MM cells as diagrammed in Fig 1A in the absence of inhibitors. After MM removal at d0, the MC4 were cultured in OB differentiation media for 2 to 4 days with either DMSO vehicle, MC1294 (10 μM), or GSK126 (5 μM) added as indicated. (A,B) The effects of the inhibitors (A) MC1294 (HDACi) and (B) GSK126 (EZH2i) on global levels of H3K9ac, H3K27me3, H3, HDAC1, EZH2 levels in MC4 cells on day 2 were assessed by Western blot using antibodies as indicated. (CF) Effects of the inhibitors MC1294 and GSK126 on (C) Runx2, (D) Ocn, (E) Bsp, and (F) Alpl mRNA expression during differentiation of control and 5TGM1 MM-exposed MC4 at day 0 (no inhibitor) or after 4 days of differentiation (d0±MM, d4±MM). Error bars represent SEM for 3 biological replicates. (G) Human MM1.S MM cells in transwells (or empty control transwells) were co-cultured with MC14 cells for 72 h. Following transwell removal, the MC14 cells were cultured in osteogenic media +/- GSK126 (2.5 μM) and mineralization was assessed using Alizarin Red staining at d21; the GSK126 was absent d14–21. Shown is density quantitation for the average of 6 wells with SEM and significance indicated.
Figure 6
Figure 6. MM-BMSC samples exhibited decreased H3K9Ac at the hRUNX2 promoter compared to HD-BMSC and inhibition of either HDAC1 or EZH2 rescues MM-BMSC OB differentiation
(A) Anti-H3K9Ac (and IgG) ChIP-qPCR analysis of HD-BMSC (N) (n=6) and MM-BMSC (MM) (n=12, patient characteristics in Table S3) using amplicons +185 and +66065 relative to the hRUNX2 P1 TSS. One anti-H3K9Ac ChIP amplicon +185 N sample result was used as the reference sample for all other data and ΔΔCt shown. (B) Anti-H3K27me3 (and IgG) ChIP-qPCR analysis of HD-BMSC (n=6), which included two donors used in A, and a unique set of MM-BMSC (n=12, patient characteristics in Table S4), using amplicons -97 and +66065 as described in A. There were no significant differences in the IgG pulldown results across all samples and between the amplicons. The significance of differences between N and MM samples for each amplicon were determined by one-way ANOVA with Tukey’s multiple comparison post-test using Graphpad Prism 6. (C, D) MM-BMSC from two different patients (Table S5) were cultured 7, 14, or 21 days in osteogenic media supplemented with vehicle, MC1294 (10 μM) or GSK126 (2.5 μM); the inhibitors were absent d14–21. Mineralization was assessed using Alizarin Red staining. Three independent wells from each treatment group are shown as well as a representative 5X magnification. Below each set is the density quantitation for the average of 6 wells/condition with SEM and significance indicated.
Figure 7
Figure 7. Schematic of the mechanism of GFI1-induced epigenetic repression of the Runx2 locus in MM exposed pre-OB
In proliferating pre-OB cells, Runx2-P1 is in a poised bivalent configuration with paused Pol II and prominent levels of activation-ready promoter chromatin marks H3K4me3 and H3K9ac, as well as H3K27me3, with low levels of basal transcription. OB differentiation induction stimulates increased accumulation of these active chromatin marks, as well as release of Pol II into the Runx2 structural region as marked by increased Pol II Ser2P-CTD and accumulation of the H3K36me3 mark. MM exposure acts in a dual mode to repress Runx2 expression. The rapid TNFα-induced decrease in Runx2 mRNA is mediated by increased mRNA degradation. However, this is insufficient to block induction of OB differentiation. The sustained suppression of OB differentiation requires modifications of the Runx2 chromatin architecture. GFI1 binds to Runx2 and facilitates recruitment of histone co-repressors HDAC1, LSD1 and EZH2, which results in decreased active H3K9ac and H3K4me3 and increased repressive H3K27me3 chromatin marks, causing an epigenetic block refractory to transcriptional activation in response to OB differentiation signals. Inhibition of either HDAC1 or EZH2 can reverse the inhibition and allow OB differentiation.

References

    1. Roodman GD. Pathogenesis of myeloma bone disease. J Cell Biochem. 2010;109:283–91. - PubMed
    1. Saad F, Lipton A, Cook R, Chen YM, Smith M, Coleman R. Pathologic fractures correlate with reduced survival in patients with malignant bone disease. Cancer. 2007;110:1860–7. - PubMed
    1. Sonmez M, Akagun T, Topbas M, Cobanoglu U, Sonmez B, Yilmaz M, et al. Effect of pathologic fractures on survival in multiple myeloma patients: a case control study. Journal of experimental & clinical cancer research : CR. 2008;27:11. - PMC - PubMed
    1. Galson DL, Silbermann R, Roodman GD. Mechanisms of multiple myeloma bone disease. BoneKEy reports. 2012;1:135. - PMC - PubMed
    1. Giuliani N, Rizzoli V, Roodman GD. Multiple myeloma bone disease: Pathophysiology of osteoblast inhibition. Blood. 2006;108:3992–6. - PubMed

MeSH terms