. 2017 Oct;31(10):2181-2190.
doi: 10.1038/leu.2017.41. Epub 2017 Jan 25.

Frequency of regulatory T cells determines the outcome of the T-cell-engaging antibody blinatumomab in patients with B-precursor ALL

Affiliations

Frequency of regulatory T cells determines the outcome of the T-cell-engaging antibody blinatumomab in patients with B-precursor ALL

J Duell et al. Leukemia. 2017 Oct.

Abstract

Blinatumomab can induce a complete haematological remission in patients in 46.6% with relapsed/refractory B-precursor acute lymphoblastic leukemia (r/r ALL) resulting in a survival benefit when compared with chemotherapy. Only bone marrow blast counts before therapy have shown a weak prediction of response. Here we investigated the role of regulatory T cells (Tregs), measured by CD4/CD25/FOXP3 expression, in predicting the outcome of immunotherapy with the CD19-directed bispecific T-cell engager construct blinatumomab. Blinatumomab responders (n=22) had an average of 4.82% Tregs (confidence interval (CI): 1.79-8.34%) in the peripheral blood, whereas non-responders (n=20) demonstrated 10.25% Tregs (CI: 3.36-65.9%). All other tested markers showed either no prediction value or an inferior prediction level including blast BM counts and the classical enzyme marker lactate dehydrogenase. With a cutoff of 8.525%, Treg enumeration can identify 100% of all blinatumomab responders and exclude 70% of the non-responders. The effect is facilitated by blinatumomab-activated Tregs, leading to interleukin-10 production, resulting in suppression of T-cell proliferation and reduced CD8-mediated lysis of ALL cells. Proliferation of patients' T cells can be restored by upfront removal of Tregs. Thus, enumeration of Treg identifies r/r ALL patients with a high response rate to blinatumomab. Therapeutic removal of Tregs may convert blinatumomab non-responders to responders.


Conflict of interest statement

MST is an advisory board member, an honorary speaker and a travel support at Amgen. JD, TB, TM, MD, TD, HE, FE, FE, EH and AR declare no conflict of interest.

Figures
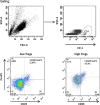
Figure 1
Figure 1
Tregs in patient material before therapy. FACS analysis of patient material before therapy. Dot plots show the percentage of CD4+CD25+FOXP3+ Tregs. One exemplary patient from the responder and one of the non-responder group is shown.
Figure 2
Figure 2
Classification performance of the final regression model with Tregs as a predictor. (a) Density of the predicted probability for responders (red) and non-responders (blue); dots denote the prediction values of individual patients. (b) Percentage of Tregs (logarithmic scale) in both groups coloured by model-based response prediction with a classification threshold of 50% prediction probability. This yields an internal accuracy of 83.3% and an estimated cross-validation accuracy estimate of 81%.
Figure 3
Figure 3
Activation and cytokine production of Tregs engaged by blinatumomab. (a) FACS analysis of upregulation of CD69, CD25 and PD-1 on Tregs of a healthy donor cocultured with NALM6 (ALL cell line) cells (red) or ALL primary blasts (blue) after 24 h stimulation with or without blinatumomab. One representative experiment out of seven (b) x-fold MFI of the markers CD69, CD25 and PD-1 of Tregs engaged by blinatumomab NALM6 or ALL cells. No significant difference between stimulation via NALM6 or primary ALL blasts, P-value>0.05. (c) Results of seven different healthy donors and six different ALL blasts from ALL patients. Cytokine profile of TH-1 (CD4+CD127high, CD25low—black) and Tregs (white) after 24 h stimulation with (+) or without (−) antibody and the cell line NALM6. Cytokine production of five different donors measured in the supernatant with cytometric bead array (CBA) technology.
Figure 4
Figure 4
Suppression of proliferation in TH-1 cells cocultured with Tregs. (a) CFSE proliferation assay of TH-1 cells cocultured with ALL cells with blinatumomab (black) or without blinatumomab (grey) after 3 days. (b) Antibody-stimulated TH-1 cells (black) cocultured with ALL cells and Tregs and TH-1 cells unstimulated without antibody cocultured with ALL and Tregs as a control. (a and b) One representative experiment out of six. (c) Suppression of proliferation in CD4CD25− cells in six healthy donors cocultured with blinatumomab-redirected Tregs, primary ALL blasts (blue) and NALM6 (red), N=6. (d) CFSE proliferation of TH-1 cells suppressed by titration of Tregs in different ratios to Th cells. Different experiments of five healthy donors.
Figure 5
Figure 5
Tregs activated with blinatumomab reduce the cytotoxic activity of effector T cells. (a) Untouched isolated CD3 and CD8 cells were cocultured with the CFSE-labelled target cell line NALM6. Tregs were added at a 1:2 Treg-to-effector cell ratio and activated with 50 ng/ml blinatumomab. After 3 days, Treg preincubation samples were loaded with CFSE-labelled NALM6 and apoptosis was measured after 24 h by Annexin V staining (n=4). (b) Significantly reduced apoptosis was detected in samples coincubated with Tregs, CD3 or CD8 cells and blinatumomab.
Figure 6
Figure 6
Tregs suppress proliferation of CD3 cells in patient PBMCs engaged with blinatumomab. (a) Depletion of Tregs in patient PBMCs. CD39 was coexpressed on Tregs in some patient PBMCs. CD39+ cells were depleted out of the PBMCs with CD39 staining and MACS bead technology. Proliferation was measured in CFSE-stained PBMCs with (blue) or without (red) Treg depletion (b) cocultured with NALM6 and +/- blinatumomab. (c) Significantly increased proliferation in CFSE-stained PBMCs after depletion of Tregs in comparison with not depleted PBMCs, P-value<0.05. Proliferation assay of PBMCS from three different ALL patients cocultured with NALM6 cells and the antibody blinatumomab. Proliferation was measured by CFSE dilution after 3 days (described in Materials and methods section). Tregs were depleted by CD39 selection and reincubated with PBMCs in the ratio 1:2 Tregs to PBMCs up to 1:16 Tregs to PBMCs.

References

    1. Richards SM, Chopra R, Lazarus HM, Litzow MR, Buck G, Durrant IJ et al. Outcome of 609 adults after relapse of acute lymphoblastic leukemia (ALL); an MRC UKALL12/ECOG 2993 study. Blood 2007; 109: 944–950. - PubMed
    1. Gökbuget N, Stanze D, Beck J, Diedrich H, Horst HA, Hüttmann A et al. Outcome of relapsed adult lymphoblastic leukemia depends on response to salvage chemotherapy, prognostic factors, and performance of stem cell transplantation. Blood 2012; 120: 2032–2041. - PubMed
    1. Kantarjian HM, Thomas D, Ravandi F, Faderl S, Jabbour E, Garcia-Manero G et al. Defining the course and prognosis of adults with acute lymphocytic leukemia in first salvage after induction failure or short first remission duration. Cancer 2010; 116: 5568–5574. - PMC - PubMed
    1. O'Brien S, Thomas D, Ravandi F, Faderl S, Cortes J, Borthakur G et al. Outcome of adults with acute lymphocytic leukemia after second salvage therapy. Cancer 2008; 113: 3186–3191. - PMC - PubMed
    1. Oriol A, Vives S, Hernandez-Rivas JM, Tormo M, Heras I, Rivas C, Tormo M, Heras I, Rivas C et al. Outcome after relapse of acute lymphoblastic leukemia in adult patients included in four consecutive risk-adapted trials by the PETHEMA Study Group. Haematologica 2010; 95: 589–596. - PMC - PubMed

Publication types

MeSH terms