. 2017 Jan 10:8:38.
doi: 10.3389/fnsyn.2016.00038. eCollection 2016.

The Role of Neuromodulators in Cortical Plasticity. A Computational Perspective

Affiliations

The Role of Neuromodulators in Cortical Plasticity. A Computational Perspective

Victor Pedrosa et al. Front Synaptic Neurosci. .

Abstract

Neuromodulators play a ubiquitous role across the brain in regulating plasticity. With recent advances in experimental techniques, it is possible to study the effects of diverse neuromodulatory states in specific brain regions. Neuromodulators are thought to impact plasticity predominantly through two mechanisms: the gating of plasticity and the upregulation of neuronal activity. However, the consequences of these mechanisms are poorly understood and there is a need for both experimental and theoretical exploration. Here we illustrate how neuromodulatory state affects cortical plasticity through these two mechanisms. First, we explore the ability of neuromodulators to gate plasticity by reshaping the learning window for spike-timing-dependent plasticity. Using a simple computational model, we implement four different learning rules and demonstrate their effects on receptive field plasticity. We then compare the neuromodulatory effects of upregulating learning rate versus the effects of upregulating neuronal activity. We find that these seemingly similar mechanisms do not yield the same outcome: upregulating neuronal activity can lead to either a broadening or a sharpening of receptive field tuning, whereas upregulating learning rate only intensifies the sharpening of receptive field tuning. This simple model demonstrates the need for further exploration of the rich landscape of neuromodulator-mediated plasticity. Future experiments, coupled with biologically detailed computational models, will elucidate the diversity of mechanisms by which neuromodulatory state regulates cortical plasticity.

Keywords: acetylcholine; computational modeling; dopamine; neuromodulation; noradrenaline; synaptic plasticity.


Figures
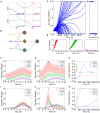
Figure 1
Figure 1
Receptive field plasticity under the effect of neuromodulation. (A) Diagram showing the four learning windows. Each learning window shows the change in synaptic strength (ΔW) as a function of the difference between the post- and presynaptic spike times (Δt = tposttpre). Blue, rule DP (Depression-Potentiation); red, rule PP (Potentiation-Potentiation); green: rule UP (Unchanged-Potentiation); pink, rule DU (Depression-Unchanged). (B) Network diagram. Firing probabilities (signals, colored traces) are independently generated and each neuron's firing probability is determined by a weighted sum of these signals. Each signal can be understood as one specific sensory feature, such as one particular tone for auditory stimulation or one particular orientation for visual stimulation. The input neurons project to one common postsynaptic neuron (gray circle). (C–E) Evolution of synaptic weights for the different learning rules. (C) Evolution of weights for a simulation with 100 presynaptic neurons projecting to one postsynaptic neuron. The excitatory weights follow the DP rule with the amplitude for depression slightly greater than the amplitude for potentiation. The small difference in amplitude is enough to generate bimodal distribution of weights. (D) Final distribution of weights in (C). The synaptic weights are in the vertical axis and the counts of synaptic weights in each interval are in the horizontal axis. (E) First 10 seconds of the evolution of weights for plasticity rules PP, UP and DU (red, green and pink, respectively). The weights quickly achieve the upper or lower bounds. (F–K) Simulation of a network with 10 presynaptic neurons. The excitatory connections follow the four STDP rules in (A). (F) Final synaptic weights for each input neuron, except black line, which is the initial weights. The initial receptive field was tuned to input neuron 7 (grey arrow). All the inputs had the same intensity. (G) Final synaptic weights for each input neuron when stimulus 4 (training input, black arrow) is 100% stronger than the other stimuli. Black curve shows the initial weights, tuned to input neuron 7 (grey arrow). (H) Difference between the synaptic weight from input neuron 4 (training input) and the weight from input neuron 7 (initial preferred input) as a function of time. We call this difference ‘input specificity’. (I–K) Same as (F–H) but for a system in which the excitatory weights are also constrained by a normalization rule. In Figures (F–K), curves show the mean averaged over 100 trials and shaded areas represent one standard deviation from the mean.
Figure 2
Figure 2
Modulation of activity vs modulation of learning rate. A network with one pre- and one postsynaptic neuron was simulated (in A, B, D and E). The synaptic weight changed following a standard STDP rule with amplitude α and the presynaptic neuron fired with firing rate ν. For synaptic weight w = 0, the postsynaptic neuron fired with firing rate ~10 Hz. (A) Ratio between the synaptic change and the synaptic weight as a function of the weight for different values of α, with α0 = 0.0005 and presynaptic firing rate ν = 10 Hz. (B) Ratio between the synaptic change and the synaptic weight as a function of the amplitude of learning for w = 3.0 (red) and w = 7.0. In both cases, the presynaptic firing rate was set to ν = 10 Hz. (C) Synaptic weights for a feedforward network with 10 presynaptic neurons and one postsynaptic neuron. The final synaptic weights were calculated for low presynaptic neuronal activity (ν = 1 Hz) and two values of learning rate: α = 0.01 (small α, red curve) and α = 0.02 (large α, blue curve). The initial and final tuning curves were re-scaled by dividing all the tuning curves by their respective maximum weights. The increase in α always sharpens the receptive field tuning (for low presynaptic activity). (D) Ratio between the synaptic change and the synaptic weight as a function of the weight for different values of ν, with ν0 = 10 Hz and the amplitude of learning α = 0.0005. (E) Ratio between the synaptic change and the synaptic weight as a function of the presynaptic neuronal firing rate for w = 3.0 (red) and w = 7.0. In both cases, the amplitude of learning was set to α = 0.0005. (F) Synaptic weights for a feedforward network with 10 presynaptic neurons and one postsynaptic neuron. The final synaptic weights were calculated for learning rate α = 0.02 and two values of presynaptic activity: ν = 1 Hz (small ν, red curve) and ν = 10 Hz (large ν, blue curve). The initial and final receptive fields were re-scaled by dividing all the tuning curves by their respective maximum weights. The modulation of neuronal activity, ν, can lead to either a sharpening or a flattening of receptive field tuning, depending on the value of ν. In Figures (A,B,D,E), the curves are averages over 200 trials. In Figures (C,F), the curves are averages over 50 trials.

Similar articles

Cited by

References

    1. Abbott L. F., Blum K. I. (1996). Functional significance of long-term potentiation for sequence learning and prediction. Cereb. Cortex 6, 406–416. 10.1093/cercor/6.3.406 - DOI - PubMed
    1. Abbott L. F., Nelson S. B. (2000). Synaptic plasticity: taming the beast. Nat. Neurosci. 3(Suppl), 1178–1183. 10.1038/81453 - DOI - PubMed
    1. Babadi B., Abbott L. F. (2016). Stability and competition in multi-spike models of spike-timing dependent plasticity. PLoS Comput. Biol. 12:e1004750. 10.1371/journal.pcbi.1004750 - DOI - PMC - PubMed
    1. Bakin J. S., Weinberger N. M. (1996). Induction of a physiological memory in the cerebral cortex by stimulation of the nucleus basalis. Proc. Natl. Acad. Sci. U.S.A. 93, 11219–11224. 10.1073/pnas.93.20.11219 - DOI - PMC - PubMed
    1. Bear M. F., Singer W. (1985). Modulation of visual cortical plasticity by acetylcholine and noradrenaline. Nature 320, 172–176. 10.1038/320172a0 - DOI - PubMed