. 2017 Jan 10:7:663.
doi: 10.3389/fphys.2016.00663. eCollection 2016.

Trace Metals Derived from Electronic Cigarette (ECIG) Generated Aerosol: Potential Problem of ECIG Devices That Contain Nickel

Affiliations

Trace Metals Derived from Electronic Cigarette (ECIG) Generated Aerosol: Potential Problem of ECIG Devices That Contain Nickel

Dominic L Palazzolo et al. Front Physiol. .

Abstract

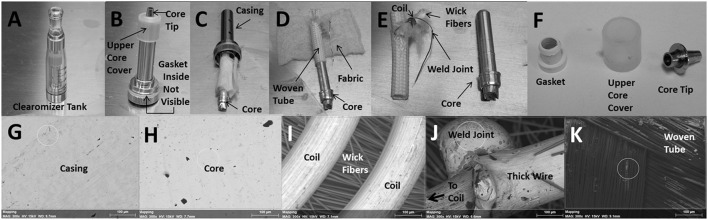
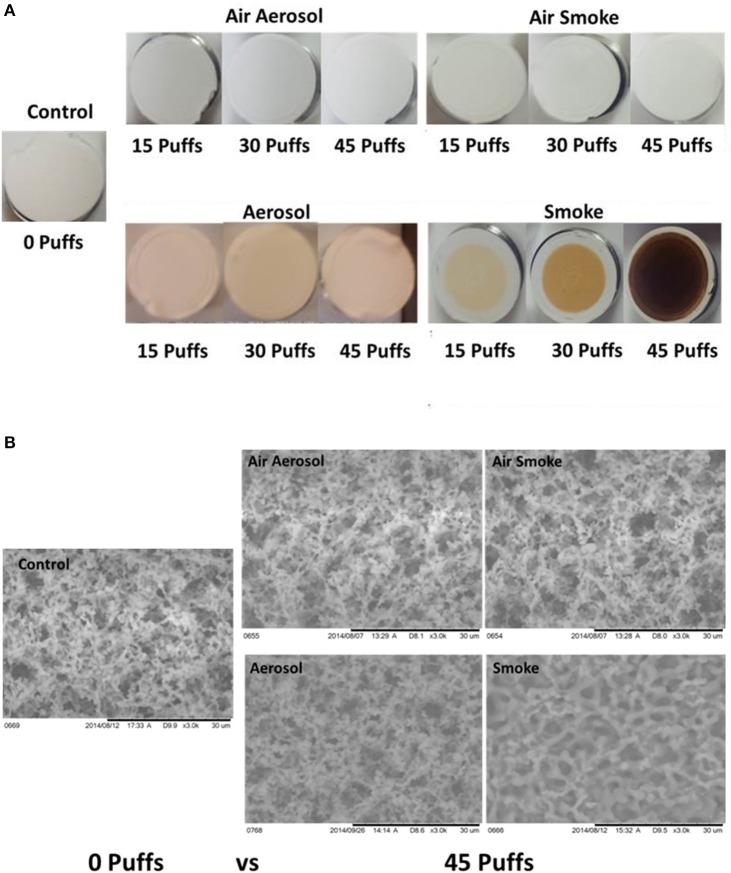
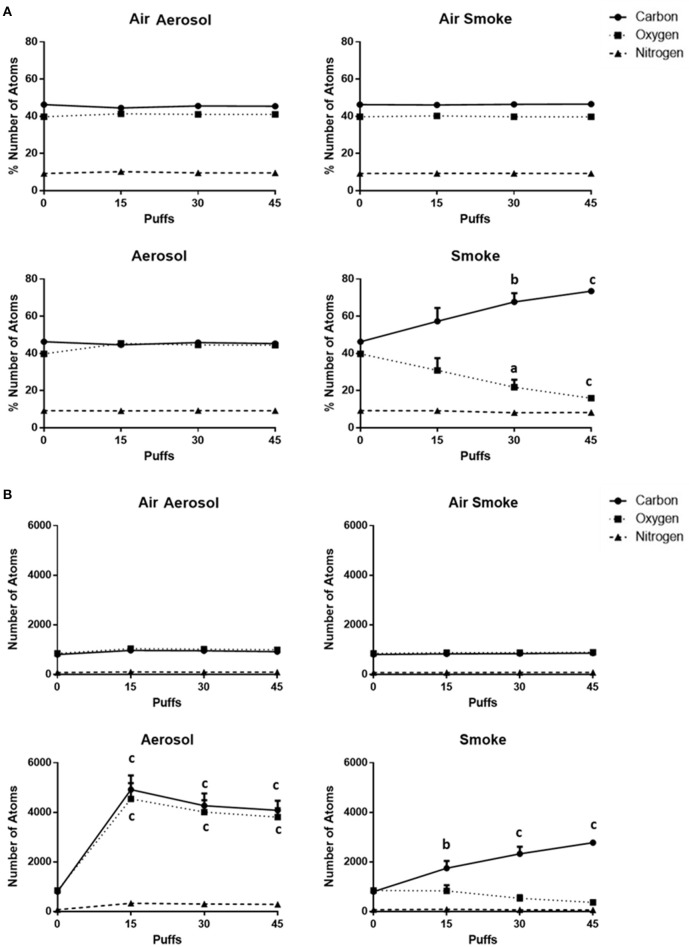
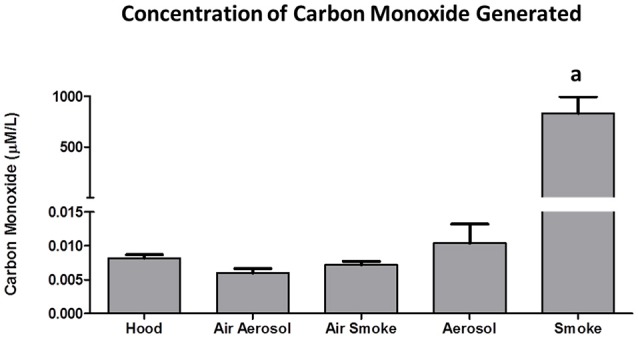
Introduction: ECIGs are currently under scrutiny concerning their safety, particularly in reference to the impact ECIG liquids (E-liquids) have on human health. One concern is that aerosolized E-liquids contain trace metals that could become trapped in respiratory tissues and induce pathology. Methods: To mimic this trapping, peristaltic pumps were used to generate and transport aerosol onto mixed cellulose ester (MCE) membranes where aluminum (Al), arsenic (As), cadmium (Cd), copper (Cu), iron (Fe), manganese (Mn), nickel (Ni), lead (Pb), and zinc (Zn) were subsequently captured and quantified. The presence of trace metals on unexposed MCE membranes and on MCE membranes exposed to mainstream smoke served as control and comparison, respectively. The presence of these metals was also determined from the E-liquid before aerosolization and untouched by the ECIG device. All metals were quantified using ICP-MS. The ECIG core assembly was analyzed using scanning electron microscopy with elemental analysis capability. Results: The contents (μg) of Al, As, Cd, Cu, Fe, Mn, Ni, Pb, and Zn on control MCE membranes were 1.2 ± 0.2, 0.050 ± 0.002, 0.047 ± 0.003, 0.05 ± 0.01, 0.001 ± 0.001, 0.16 ± 0.04, 0.005 ± 0.003, 0.014 ± 0.006, and 0.09 ± 0.02, respectively. The contents of all trace metals on MCE membranes exposed to aerosol were similar to controls, except Ni which was significantly (p < 0.01) higher (0.024 ± 0.004 μg). In contrast, contents of Al, As, Fe, Mn, and Zn on MCE membranes exposed to smoke were significantly higher (p < 0.05) than controls. The contents of Al, As, Cu, Fe, and Mn on smoke-exposed MCE membranes were also significantly higher (p < 0.05) than their content on aerosol-exposed membranes. The contents per cigarette equivalent of metals in E-liquid before aerosolization were negligible compared to amounts of aerosolized E-liquid, except for Fe (0.002 μg before and 0.001 μg after). Elemental analysis of the core assembly reveals the presence of several of these trace metals, especially Al, Fe, Ni, and Zn. Conclusions: In general, from the single ECIG-device/E-liquid combination used, the amount of trace metals from ECIG-generated aerosol are lower than in traditional mainstream smoke, Only Ni in the ECIG-generated aerosol was higher than control. The most probable source of Ni in this aerosol is the core assembly.

Keywords: E-liquid; ECIG; aerosol; smoking; trace metals; vaping.


Figures

Figure 1
Figure 1
Equipment used in the puffing protocol include (A) Swinnex™ type filter holders and a Millipore Mixed Cellulose Ester (MCE) membrane, (B) Triple 3 eGo electronic cigarettes, and (C) peristaltic pumps in a Thermo Scientific Hamilton SafeAire II laminar flow hood.
Figure 2
Figure 2
Anatomy of the core assembly depicting (A) plastic “clearomizer” tank, (B) encased core, (C) core wrapped in fabric, (D) core within woven tube, (E) exposed core, woven tube and coil and (F) gasket, upper core cover, and core tip. SEM images of the (G) inner surface of core casing, (H) core, (I) coils surrounding wick fibers, (J) weld joint between coil and extension wire and (K) inner surface of woven tube. The small white circle, where visible, indicates the area in which elemental analysis was performed (see Table 2). All SEM images were observed at an acceleration voltage of 15 kV and are depicted at a magnification of 300X.
Figure 3
Figure 3
Number of puffs on the ECIG device as a function of volume (μl) of E-liquid aerosolized. Pearson r = 0.9995 and p < 0.005.
Figure 4
Figure 4
Temperatures within the laminar flow hood and within the inlet and outlet peristaltic pump tubing, before and after pumping air, ECIG-generated aerosol, and smoke. Data points given as mean ± standard error of the mean. Post-inlet between group comparisons; a = p < 0.05 at 15 and 30 puffs between aerosol and air through the aerosol pump, b = p < 0.05 at 30 puffs between aerosol and air through the smoke pump, c = p < 0.01 at 45 puffs between aerosol and air through the aerosol pump, and d = p < 0.01 at 45 puffs between aerosol and air through the smoke pump. Post-outlet between group comparisons at 30 puffs; e = p < 0.05 between smoke and air through the aerosol pump, f = p < 0.05 between smoke and air through the smoke pump and g = p < 0.01 between smoke and aerosol. Within group comparisons between hood temperature (control) and exposure to smoke (h = p < 0.05) or aerosol (i = p < 0.05).
Figure 5
Figure 5
(A) Visual inspection Of MCE membranes after 0, 15, and 45 puffs of air, ECIG-generated aerosol and smoke and (B) SEM analysis of MCE membranes after exposure to 0 and 45 puffs of air, ECIG-generated aerosol and smoke. All SEM images shown at 3000X.
Figure 6
Figure 6
(A) Percentages of and (B) total numbers of (based on sampling area) C, O, and N atoms on MCE membranes after exposure to 0, 15, 30, and 45 puffs of air, ECIG-generated aerosol and smoke. Data points given as mean ± standard error of the mean. Comparisons between 0 puffs (control) and 15, 30, or 45 puffs where a = p < 0.01, b = p < 0.005 and c = p < 0.001.
Figure 7
Figure 7
Concentrations of CO collected from 3 puffs of air, ECIG-generated aerosol, and smoke. Data points given as mean ± standard error of the mean. a = p < 0.001.

References

    1. Abrams D. B., Niaura R. (2015). The importance of science-informed policy and what the data really tell us about e-cigarettes. Isr. J. Health Policy Res. 4:22. 10.1186/s13584-015-0021-z - DOI - PMC - PubMed
    1. Bandyopadhyay A., Bhattacharjee I., Dalui R., Pal S. (2013). Pulmonary function studies of healthy non-smoking male University students of Kolkata, India–revisited. Malays. J. Med. Sci. 20, 17–24. - PMC - PubMed
    1. Bates C. D., Farsalinos K. E. (2015). Research letter on E-cigarette cancer risk was so misleading it should be retracted. Addiction 110, 1686–1687. 10.1111/add.13018 - DOI - PubMed
    1. Baumung C., Rehm J., Franke H., Lachenmeier D. W. (2016). Comparative risk assessment of tobacco smoke constituents using the margin of exposure approach: the neglected contribution of nicotine. Sci. Rep. 6:35577. 10.1038/srep35577 - DOI - PMC - PubMed
    1. Bernhard D., Rossmann A., Wick G. (2005). Metals in cigarette smoke. IUBMB Life 57, 805–809. 10.1080/15216540500459667 - DOI - PubMed