. 2017 Jan 10:7:675.
doi: 10.3389/fphys.2016.00675. eCollection 2016.

Physiological Responses to Two Hypoxic Conditioning Strategies in Healthy Subjects

Affiliations

Physiological Responses to Two Hypoxic Conditioning Strategies in Healthy Subjects

Samarmar Chacaroun et al. Front Physiol. .

Abstract

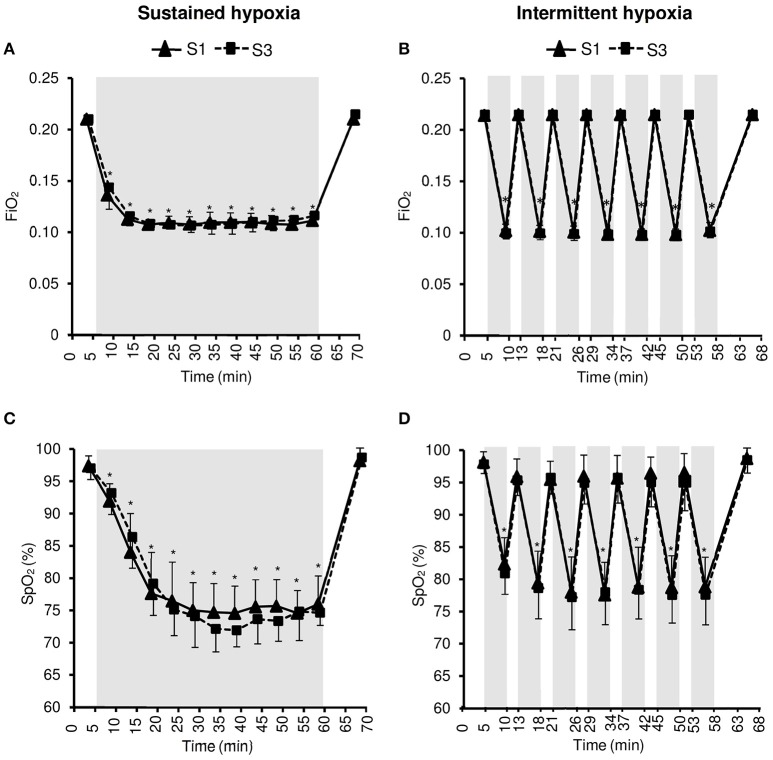
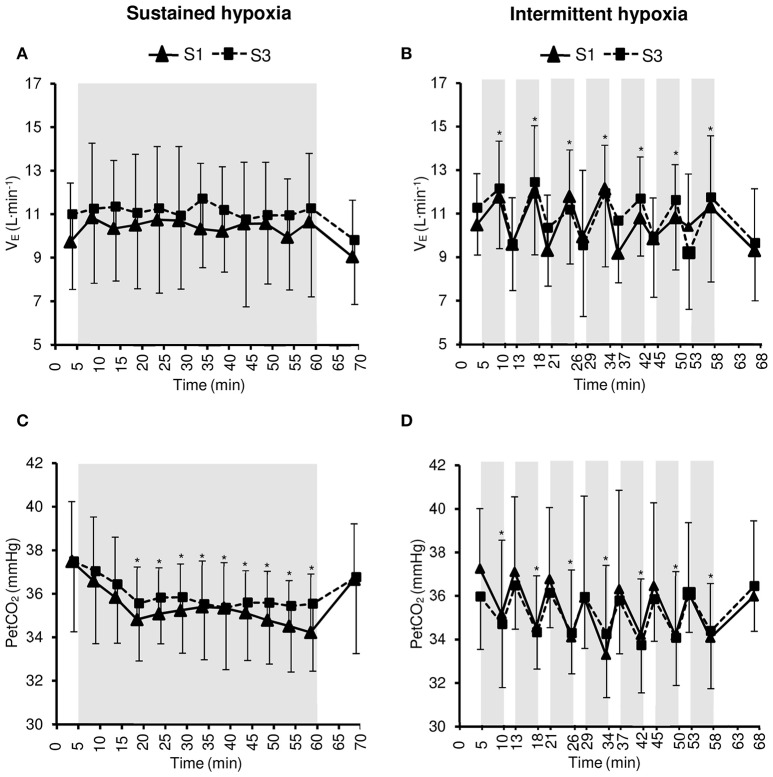
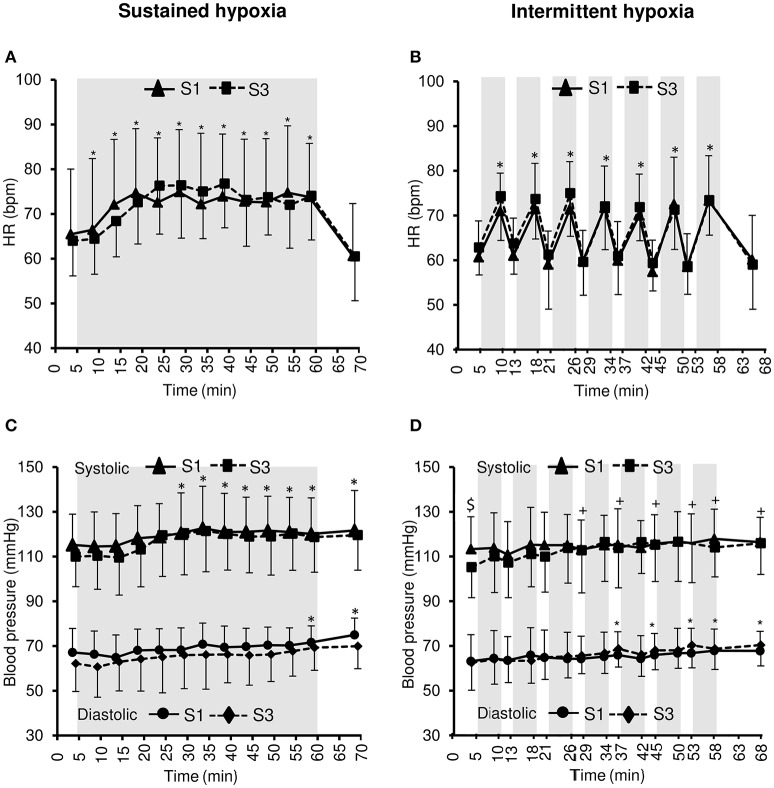
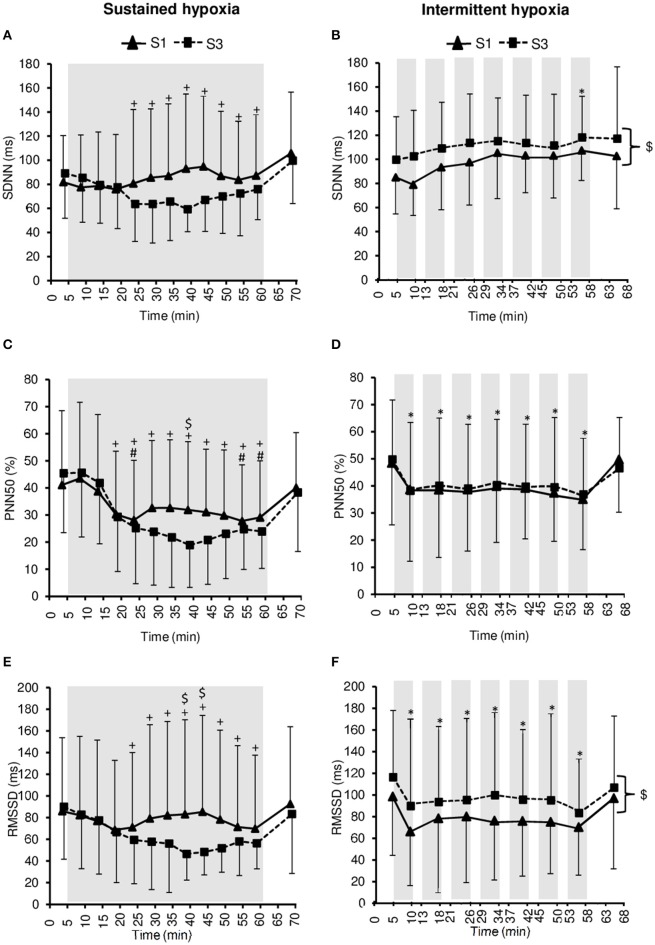
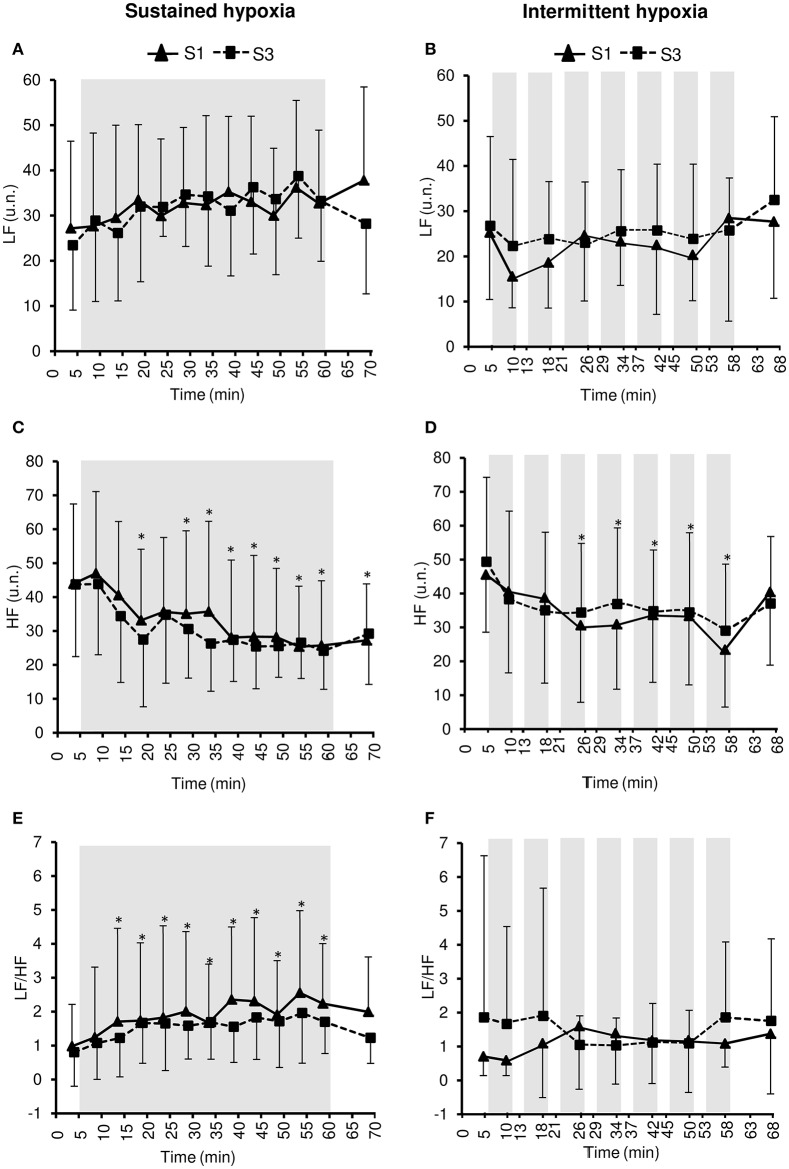
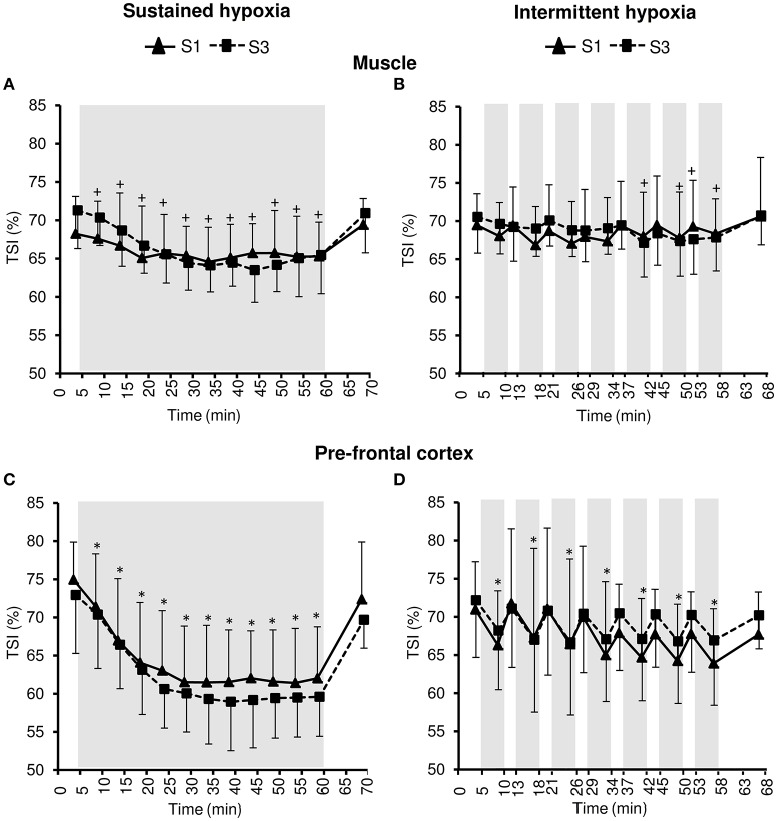
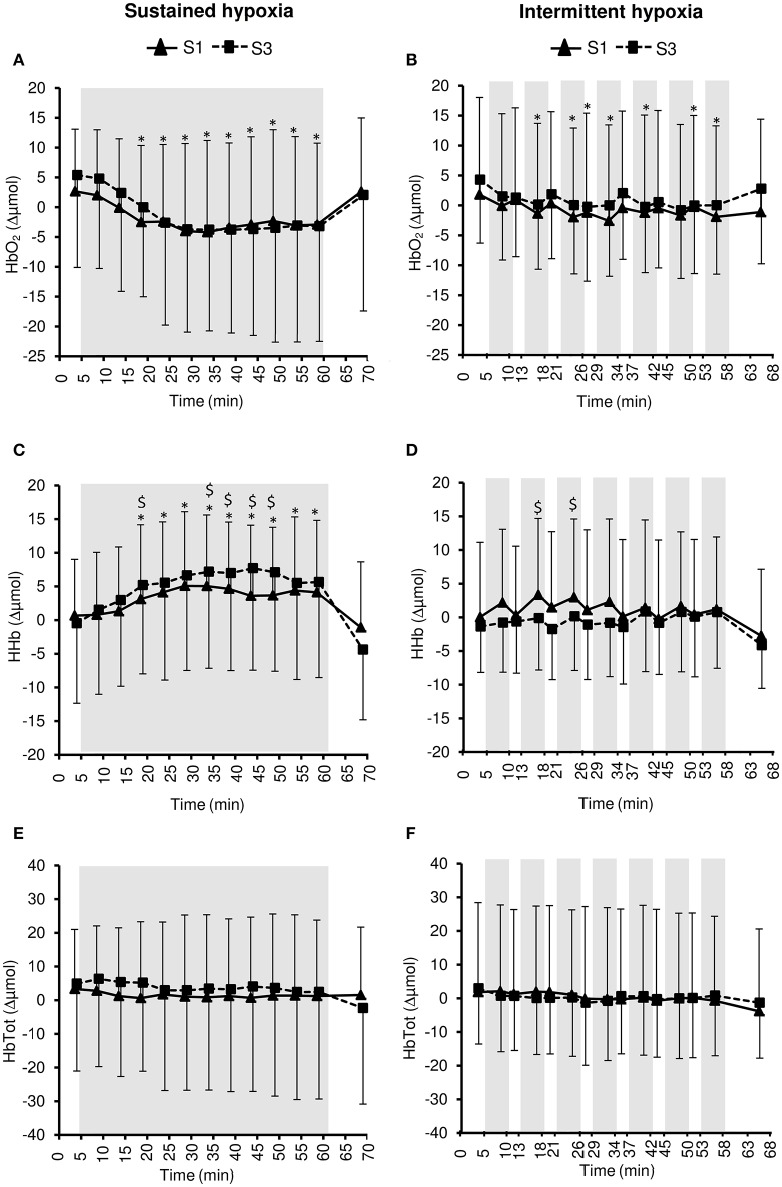
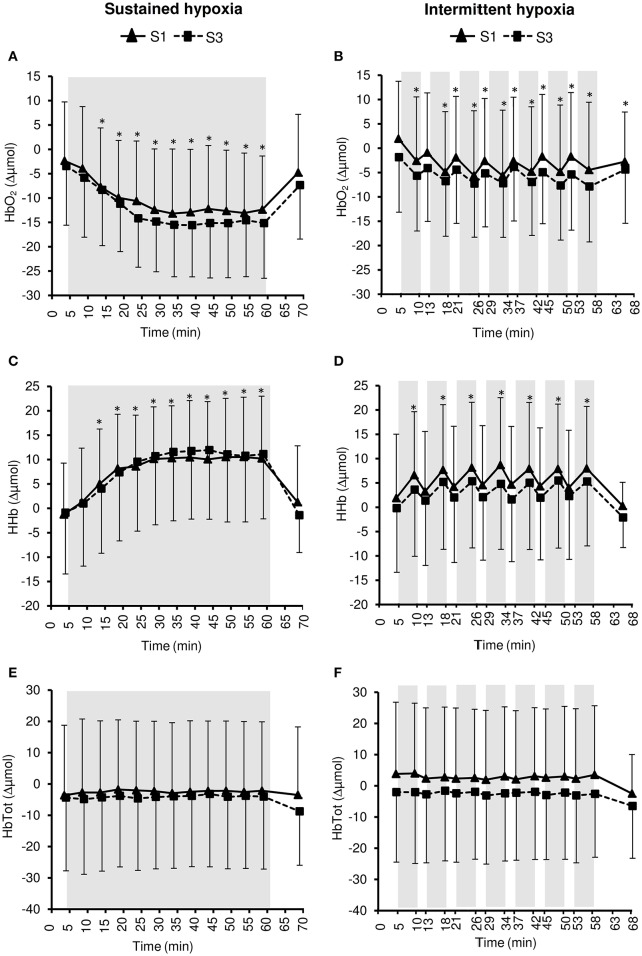
Objective: Hypoxic exposure can be used as a therapeutic tool by inducing various cardiovascular, neuromuscular, and metabolic adaptations. Hypoxic conditioning strategies have been evaluated in patients with chronic diseases using either sustained (SH) or intermittent (IH) hypoxic sessions. Whether hypoxic conditioning via SH or IH may induce different physiological responses remains to be elucidated. Methods: Fourteen healthy active subjects (7 females, age 25 ± 8 years, body mass index 21.5 ± 2.5 kg·m-2) performed two interventions in a single blind, randomized cross-over design, starting with either 3 x SH (48 h apart), or 3 x IH (48 h apart), separated by a 2 week washout period. SH sessions consisted of breathing a gas mixture with reduced inspiratory oxygen fraction (FiO2), continuously adjusted to reach arterial oxygen saturations (SpO2) of 70-80% for 1 h. IH sessions consisted of 5 min with reduced FiO2 (SpO2 = 70-80%), followed by 3-min normoxia, repeated seven times. During the first (S1) and third (S3) sessions of each hypoxic intervention, cardiorespiratory parameters, and muscle and pre-frontal cortex oxygenation (near infrared spectroscopy) were assessed continuously. Results: Minute ventilation increased significantly during IH sessions (+2 ± 2 L·min-1) while heart rate increased during both SH (+11 ± 4 bpm) and IH (+13 ± 5 bpm) sessions. Arterial blood pressure increased during all hypoxic sessions, although baseline normoxic systolic blood pressure was reduced from S1 to S3 in IH only (-8 ± 11 mmHg). Muscle oxygenation decreased significantly during S3 but not S1, for both hypoxic interventions (S3: SH -6 ± 5%, IH -3 ± 4%); pre-frontal oxygenation decreased in S1 and S3, and to a greater extent in SH vs. IH (-13 ± 3% vs. -6 ± 6%). Heart rate variability indices indicated a significantly larger increase in sympathetic activity in SH vs. IH (lower SDNN, PNN50, and RMSSD values in SH). From S1 to S3, further reduction in heart rate variability was observed in SH (SDNN, PNN50, and RMSSD reduction) while heart rate variability increased in IH (SDNN and RMSSD increase). Conclusions: These results showed significant differences in heart rate variability, blood pressure, and tissue oxygenation changes during short-term SH vs. IH conditioning interventions. Heart rate variability may provide useful information about the early adaptations induced by such intervention.

Keywords: blood pressure; heart rate variability; hypoxic conditioning; intermittent hypoxia; sustained hypoxia; tissue oxygenation.


Figures

Figure 1
Figure 1
Inspiratory oxygen fraction (FiO2, A,B) and arterial oxygen saturation (SpO2, C,D) during the first (S1) and the third (S3) sustained or intermittent hypoxia sessions. Data points are means ± SD. Gray areas indicate hypoxic phases. *Significantly different from normoxic baseline in both S1 and S3 (p < 0.05, two-way ANOVA main effect of time).
Figure 2
Figure 2
Minute ventilation (VE, A,B) and end-tidal CO2 partial pressure (PetCO2, C,D) during the first (S1) and the third (S3) sustained or intermittent hypoxia sessions. Data points are means ± SD. Gray areas indicate hypoxic phases. *Significantly different from normoxic baseline in both S1 and S3 (p < 0.05, two-way ANOVA main effect of time).
Figure 3
Figure 3
Heart rate (HR, A,B) and systolic and diastolic blood pressure (C,D) during the first (S1) and the third (S3) sustained or intermittent hypoxia sessions. Data points are means ± SD. Gray areas indicate hypoxic phases. *Significantly different from normoxic baseline in both S1 and S3 (p < 0.05, two-way ANOVA main effect of time); +Significantly different from normoxic baseline in S3 only (p < 0.05, two-way ANOVA session × time interaction); $Significant difference between S1 and S3 (p < 0.05, two-way ANOVA session × time interaction).
Figure 4
Figure 4
Heart rate variability indices within the time domain [standard deviation of R–R interval (SDNN), (A,B); percentage of successive R–R that varied by 50 ms or more (PNN50), (C,D); root-mean-square difference of successive normal R–R intervals (RMSSD), (E,F)] during the first (S1) and the third (S3) sustained or intermittent hypoxia sessions. Data points are means ± SD. Gray areas indicate hypoxic phases. *Significantly different from normoxic baseline in both S1 and S3 (p < 0.05, two-way ANOVA main effect of time); +Significantly different from normoxic baseline in S3 only (p < 0.05, two-way ANOVA session × time interaction); #Significantly different from normoxic baseline in S1 only (p < 0.05, two-way ANOVA session × time interaction); $Significant difference between S1 and S3 (p < 0.05, two-way ANOVA main effect of session or session × time interaction).
Figure 5
Figure 5
Heart rate variability indices within the frequency domain [low frequency in normalized units (LF), (A,B); high frequency in normalized units (HF), (C,D); LF/HF ratio, (E,F)] during the first (S1) and the third (S3) sustained or intermittent hypoxia sessions. Data points are means ± SD. Gray areas indicate hypoxic phases. *Significantly different from normoxic baseline in both S1 and S3 (p < 0.05, two-way ANOVA main effect of time).
Figure 6
Figure 6
Tissue oxygenation index (TSI) for the muscle (A,B) and the prefrontal cortex (C,D) during the first (S1) and the third (S3) sustained or intermittent hypoxia sessions. Data points are means ± SD. Gray areas indicate hypoxic phases. *Significantly different from normoxic baseline in both S1 and S3 (p < 0.05, two-way ANOVA main effect of time); +Significantly different from normoxic baseline in S3 only (p < 0.05, two-way ANOVA session × time interaction).
Figure 7
Figure 7
Muscle oxy- ([HbO2], A,B), deoxy- ([HHb], C,D), and total- ([HbTot], E,F) hemoglobin concentration changes during the first (S1) and the third (S3) sustained or intermittent hypoxia sessions. Data points are means ± SD. Gray areas indicate hypoxic phases. *Significantly different from normoxic baseline in both S1 and S3 (p < 0.05, two-way ANOVA main effect of time); $Significant difference between S1 and S3 (p < 0.05, two-way ANOVA session × time interaction).
Figure 8
Figure 8
Pre-frontal cortex oxy- ([HbO2], A,B), deoxy- ([HHb], C,D), and total- ([HbTot], E,F) hemoglobin concentration changes during the first (S1) and the third (S3) sustained or intermittent hypoxia sessions. Data points are means ± SD. Gray areas indicate hypoxic phases. *Significantly different from normoxic baseline in both S1 and S3 (p < 0.05, two-way ANOVA main effect of time).

Similar articles

Cited by

References

    1. Almendros I., Farré R., Planas A. M., Torres M., Bonsignore M. R., Navajas D., et al. . (2011). Tissue oxygenation in brain, muscle, and fat in a rat model of sleep apnea: differential effect of obstructive apneas and intermittent hypoxia. Sleep 34, 1127–1133. 10.5665/sleep.1176 - DOI - PMC - PubMed
    1. Almendros I., Wang Y., Gozal D. (2014). The polymorphic and contradictory aspects of intermittent hypoxia. Am. J. Physiol. Lung Cell Mol. Physiol. 307, L129–L140. 10.1152/ajplung.00089.2014 - DOI - PMC - PubMed
    1. Béguin P. C., Joyeux-Faure M., Godin-Ribuot D., Lévy P., Ribuot C. (2005). Acute intermittent hypoxia improves rat myocardium tolerance to ischemia. J. Appl. Physiol. 99, 1064–1069. 10.1152/japplphysiol.00056.2005 - DOI - PubMed
    1. Bernardi L., Passino C., Serebrovskaya Z., Serebrovskaya T., Appenzeller O. (2001b). Respiratory and cardiovascular adaptations to progressive hypoxia; effect of interval hypoxic training. Eur. Heart J. 22, 879–886. 10.1053/euhj.2000.2466 - DOI - PubMed
    1. Bernardi L., Passino C., Wilmerding V., Dallam G. M., Parker D. L., Robergs R. A., et al. . (2001a). Breathing patterns and cardiovascular autonomic modulation during hypoxia induced by simulated altitude. J. Hypertens. 19, 947–958. 10.1097/00004872-200105000-00016 - DOI - PubMed

LinkOut - more resources