. 2017 Feb;24(1):118-137.
doi: 10.3758/s13423-016-1166-7.

Culture and biology in the origins of linguistic structure

Affiliations

Culture and biology in the origins of linguistic structure

Simon Kirby. Psychon Bull Rev. 2017 Feb.

Abstract

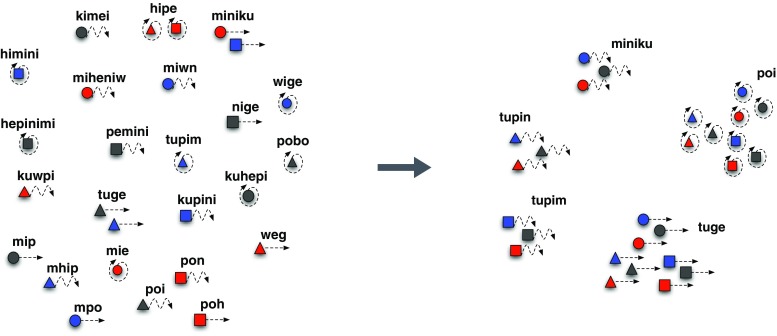
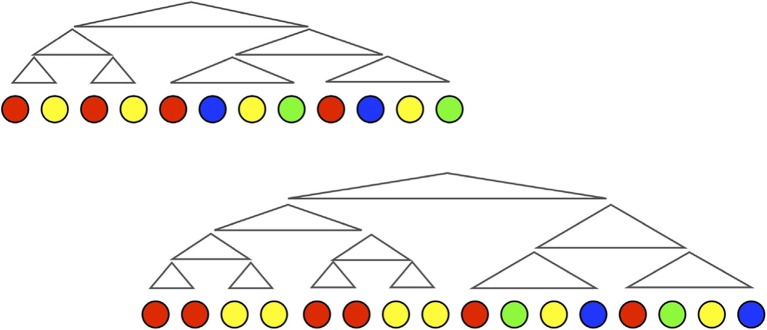
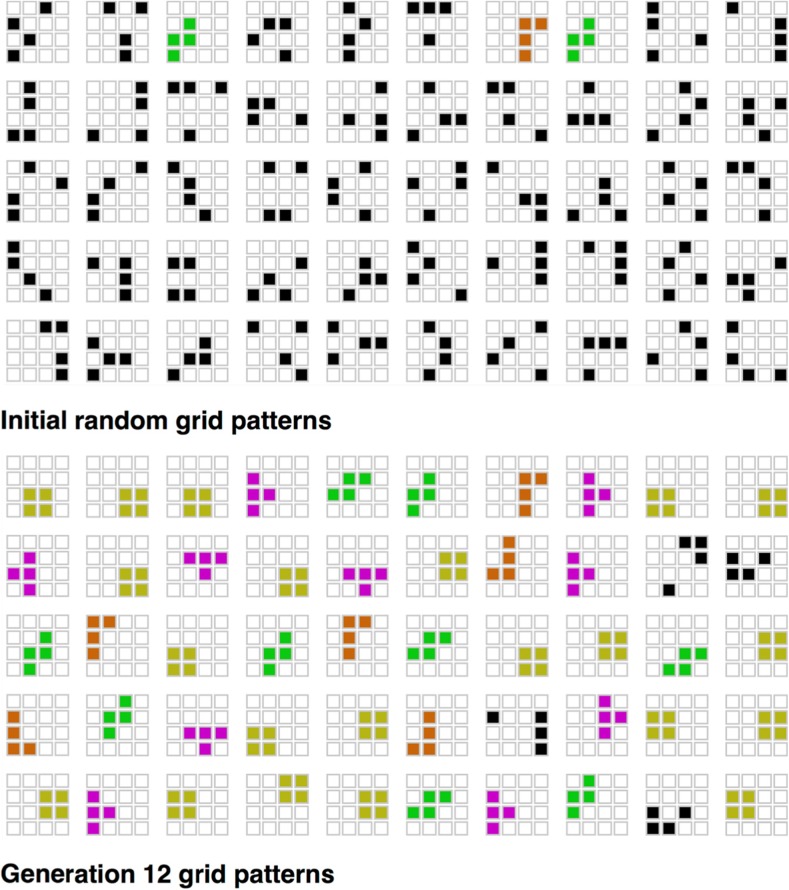
Language is systematically structured at all levels of description, arguably setting it apart from all other instances of communication in nature. In this article, I survey work over the last 20 years that emphasises the contributions of individual learning, cultural transmission, and biological evolution to explaining the structural design features of language. These 3 complex adaptive systems exist in a network of interactions: individual learning biases shape the dynamics of cultural evolution; universal features of linguistic structure arise from this cultural process and form the ultimate linguistic phenotype; the nature of this phenotype affects the fitness landscape for the biological evolution of the language faculty; and in turn this determines individuals' learning bias. Using a combination of computational simulation, laboratory experiments, and comparison with real-world cases of language emergence, I show that linguistic structure emerges as a natural outcome of cultural evolution once certain minimal biological requirements are in place.

Keywords: Computational modeling; Cultural evolution; Iterated learning; Language evolution.


Figures

Fig. 1
Fig. 1
Language evolution involves dual inheritance mechanisms. The language faculty is shaped by genes that are inherited and evolve biologically. The language we speak is the product of a second, cultural inheritance mechanism as grammars arise from the interaction between our language faculty and utterances we are exposed to
Fig. 2
Fig. 2
Example results from Brighton’s (2002) simulation of iterated learning. Each diagram shows a finite state transducer that maps between sequences of characters (representing signals) and feature vectors (representing meanings). Each transducer is labelled with a number indicating which generation it came from. The details are not important (and, indeed, are too small to be visible in this figure), but it is clear that transducers early in the simulation are larger and more complex than later ones. Importantly, despite this the early complex languages are less expressive. The transducers do not cover the entire possible set of meanings in the simulation. However, by the end, highly compact representations have emerged. These later languages are completely general, expressing the entire set of meanings in a compositional way such that different substrings correspond to different features of the meaning
Fig. 3
Fig. 3
Results from the Bayesian iterated learning model in Kirby et al. (2007). Languages vary in their regularity in this model, and five examples are shown in order of decreasing regularity. The solid line represents the prior bias of the learners favouring regularity. In the top graph, the bias is relatively strong, whereas in the bottom it is vanishingly small (all languages have almost but not quite the same prior probability). The various dashed lines indicate the distribution of languages that arise from cultural evolution with different amounts of training data each generation. As the number of training examples (m) decreases, the bottleneck on transmission tightens and the prior preference for regular languages is amplified. However, different prior bias strengths have no effect on the distribution of languages that emerges
Fig. 4
Fig. 4
Language structure arises from a complex set of interactions between three complex adaptive systems operating at different scales
Fig. 5
Fig. 5
Results from the coevolutionary model with two different starting points (Thompson et al., 2016). The plots on the left show the distribution of genes that evolve, with high or low values of “i” on the x-axis indicating a strong constraint in favour of Type 1 or Type 0 languages, respectively, and a value of 50 indicating no bias. The plots on the right show time courses indicating how the genes of the population evolve (values greater than 0.5 indicating a bias in favour of Type 1), and how the languages evolve culturally (high values indicating a prevalence of languages of Type 1 in the population). The top row shows the outcome of gene-culture coevolution with an initial population of unbiased learners and a very slight majority of languages of Type 1 being spoken in the population. The bottom row shows the outcome with an initial population of strongly constrained learners. In both cases the outcome is the same: a strong universal preference for languages of Type 1 in the culture, but the weakest possible bias in favour of languages of Type 1 in the language faculty of the learners. (Thanks to Bill Thompson for the graph; for more details and explanation, see Thompson, 2015)
Fig. 6
Fig. 6
Example languages from Kirby, Cornish. and Smith’s (2008) experimental iterated learning study. The language on the left is the output of the first learner in a transmission chain, after they attempted to learn an initial randomly generated language. In this experiment, the language labelled 27 different scenes involving different coloured shapes moving. The language changed gradually as it was passed down 10 generations of learners to become the one indicated on the right. The same 27 scenes are now labelled with only five words, which carve up the space in systematic ways, for example by movement. The language on the left is unlearnable from a subsample, whereas the language on the right is easy to learn. (Colour figure online)
Fig. 7
Fig. 7
Example languages from Kirby, Tamariz,, and Smith’s (2015) experiment involving both interaction and transmission to new learners (A), and interaction alone (B). Compositional structure emerges in the former case where both learning and communication put pressure on the language to be both compressible and expressive. Here, the language uses a prefix to indicate shape and a suffix to indicate the fill texture. When only interaction is involved, a largely uncompressible, holistic language emerges
Fig. 8
Fig. 8
Languages from the simulation in Kirby et al. (2015). Each language maps between a simple meaning space (consisting of two binary features, here represented as colour and shape) and a signal space (consisting of strings of length, two from an alphabet of two characters). The prior for each language is based on the coding length of the language in bits (L). This is computed by first representing the language as a grammar with semantic annotations, and then encoding that grammar in a minimally redundant form as a string of characters. The coding length of that string reflects our intuitions that a degenerate language with a single word is simpler than a holistic language with a distinct word for each meaning, and that the complexity of a compositional language lies between these two extremes
Fig. 9
Fig. 9
Two sequences drawn from the final set of 60 sequences in the last generation of one of the chains in Cornish et al.’s (2013) experiment. Note how the structure of the two is similar, with the exception that the second involved a doubling of the elements in the first part of the sequence. The hierarchical structure shown is suggested by the parallels between these and other sequences in the set. (Colour figure online)
Fig. 10
Fig. 10
The initial and final grid patterns from one of the chains in (Claidiere et al., 2014) baboon study. The initial patterns were a set of 50 4 × 4 grids in which four cells were lit up. The baboons were rewarded for recalling the four lit squares correctly for each grid pattern, and their responses were transmitted to the next baboon in the chain. After 12 generations, the set of patterns had evolved to become systematic, with each chain having a particular distribution of statistically rare patterns known as tetrominos (highlighted in colour in the example). Importantly, the baboons did not find the tetrominos easier to copy when they occurred singly in a set of random grids. It was only when they appeared alongside other tetrominos in the set of 50 that the transmissibility advantage emerged. (Colour figure online)

Comment in

References

    1. Andersen H. Abductive and deductive change. Language. 1973;49(4):765–793. doi: 10.2307/412063. - DOI
    1. Arbib MA, Bickerton D. The emergence of protolanguage: Holophrasis vs compositionality. Amsterdam, The Netherlands: John Benjamins; 2010.
    1. Aronoff M, Meir I, Sandler W. The paradox of sign language morphology. Language. 2005;81(2):301–344. doi: 10.1353/lan.2005.0043. - DOI - PMC - PubMed
    1. Bartlett FC. Remembering: An experimental and social study. Cambridge, UK: Cambridge University; 1932.
    1. Batali, J. (1998). Computational simulations of the emergence of grammar. In J. Hurford, M. Studdert-Kennedy & C. Knight (Eds.), Approaches to the Evolution of Language: Social and Cognitive Bases (pp. 405-426). Cambridge, UK: Cambridge University Press.

LinkOut - more resources