. 2017 Sep;38(9):1251-1258.
doi: 10.1002/humu.23185. Epub 2017 Mar 15.

Predicting enhancer activity and variant impact using gkm-SVM

Affiliations

Predicting enhancer activity and variant impact using gkm-SVM

Michael A Beer. Hum Mutat. 2017 Sep.

Abstract

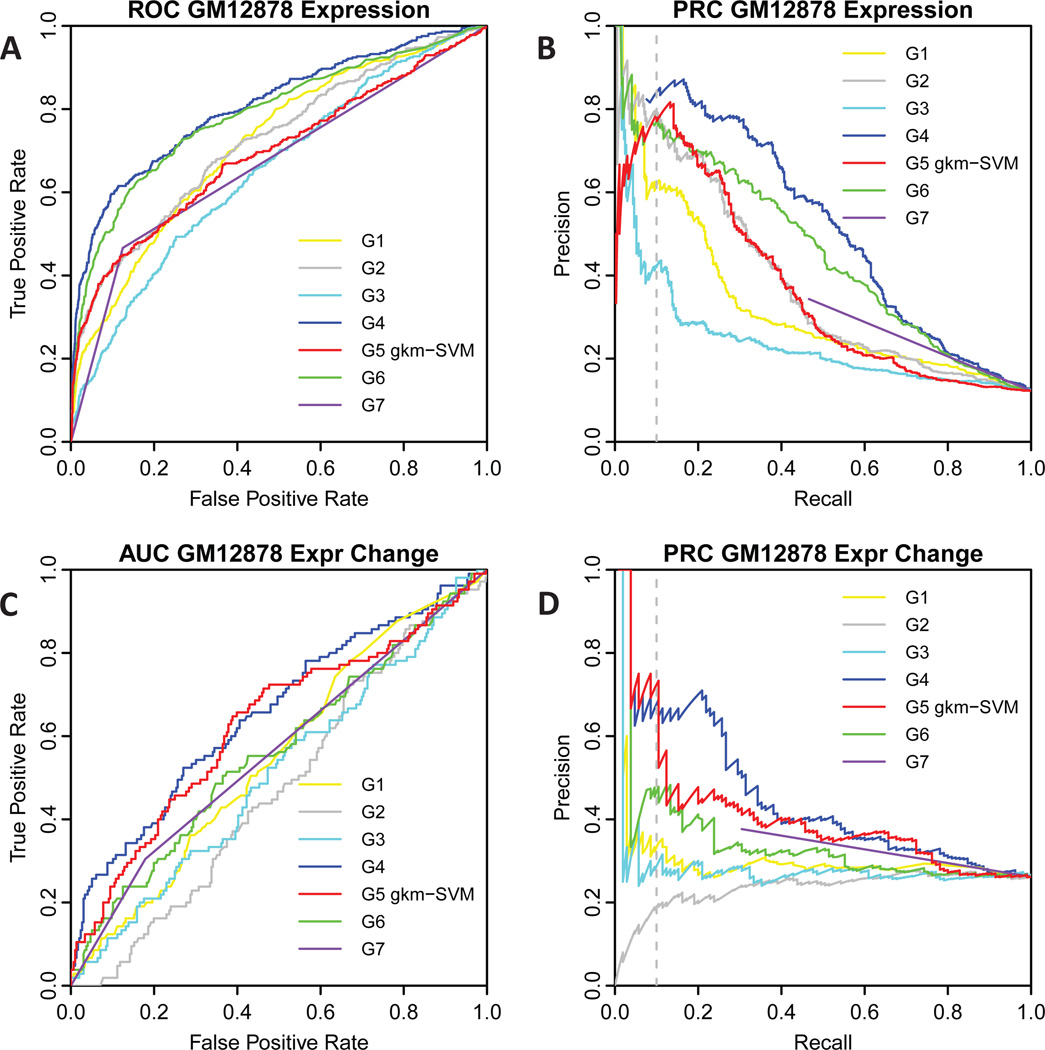
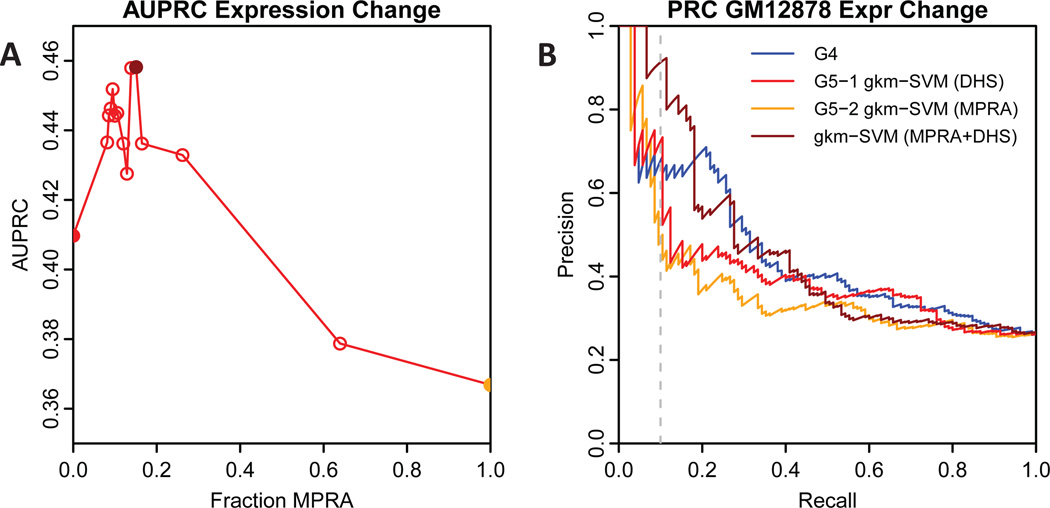
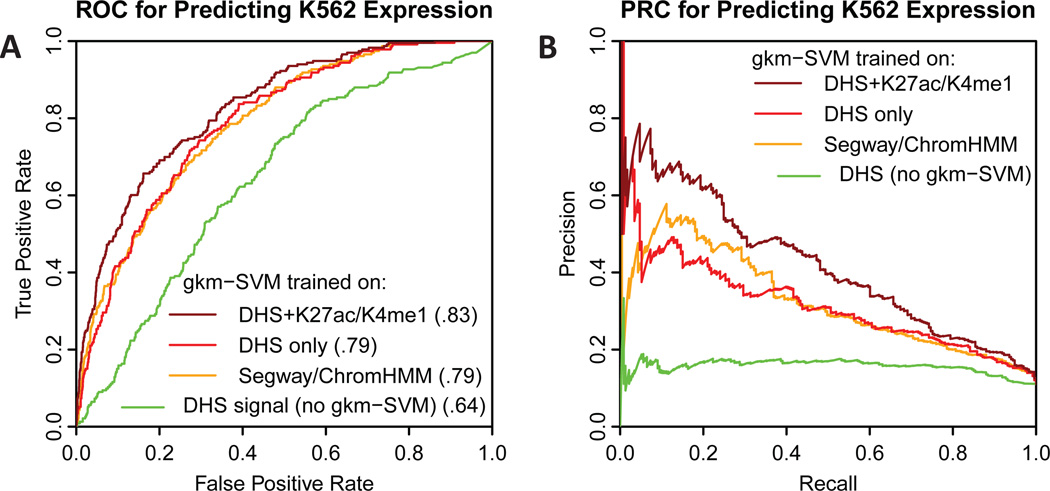
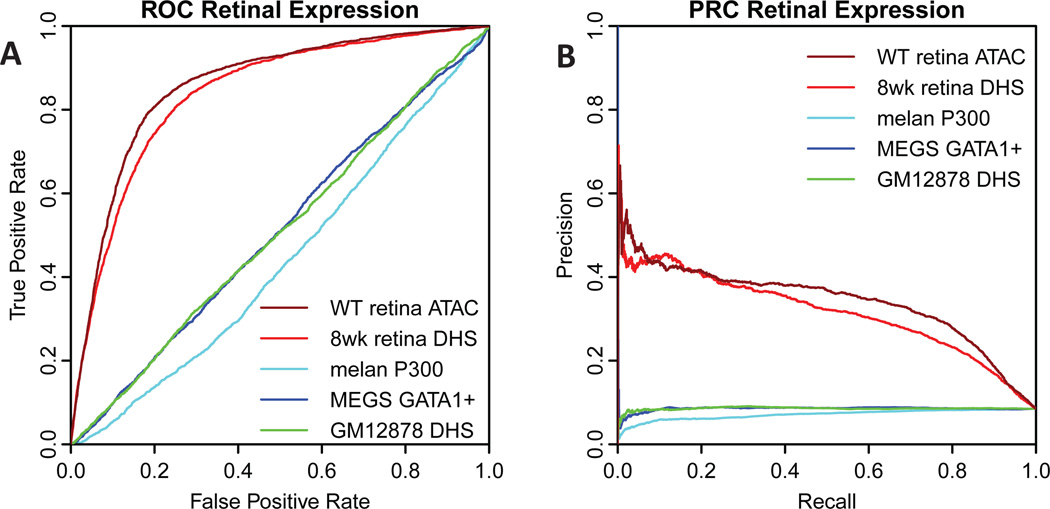
We participated in the Critical Assessment of Genome Interpretation eQTL challenge to further test computational models of regulatory variant impact and their association with human disease. Our prediction model is based on a discriminative gapped-kmer SVM (gkm-SVM) trained on genome-wide chromatin accessibility data in the cell type of interest. The comparisons with massively parallel reporter assays (MPRA) in lymphoblasts show that gkm-SVM is among the most accurate prediction models even though all other models used the MPRA data for model training, and gkm-SVM did not. In addition, we compare gkm-SVM with other MPRA datasets and show that gkm-SVM is a reliable predictor of expression and that deltaSVM is a reliable predictor of variant impact in K562 cells and mouse retina. We further show that DHS (DNase-I hypersensitive sites) and ATAC-seq (assay for transposase-accessible chromatin using sequencing) data are equally predictive substrates for training gkm-SVM, and that DHS regions flanked by H3K27Ac and H3K4me1 marks are more predictive than DHS regions alone.

Keywords: MPRA; eQTL analysis; enhancers; gene regulation; machine learning; regulatory variation.


Figures

Fig. 1
Fig. 1. Comparison of ROC and PRC curves for gkm-SVM and other prediction methods on the two eQTL challenges
A) ROC curve for eQTL challenge part one, predicting expression in GM12878. B) PRC curve for eQTL challenge part one, predicting expression in GM12878. C) ROC curve for eQTL challenge part two, predicting expression change in GM12878. D) PRC curve for eQTL challenge part two, predicting expression change in GM12878. Group numbers are labelled as in the eQTL challenge overview paper (Kreimer et al., 2016), gkm-SVM is group 5 (G5). The gkm-SVM predictions are among the most accurate for predicting both expression and variant impact, even though they do not use the MPRA training data.
Fig. 2
Fig. 2. AUPRC for gkm-SVM trained on combined MPRA and DHS data
A) AUPRC for predicting expression change as the fraction of MPRA training data is varied from zero (method 5-1, red filled circle) to one (method 5-2, orange filled circle). Maximum AUPRC is achieved near 15% MPRA (dark red filled circle). B) PRC curve comparison for the top submitted method (4-1, blue), the two gkm-SVM submitted methods (red and orange), and gkm-SVM trained on 15% MPRA+DHS (dark red).
Fig. 3
Fig. 3. Comparison of ROC and PRC curves for predicting MPRA expression in K562 cells
A) ROC and B) PRC for predicting MPRA expression in K562 cells (Kwasnieski et al., 2014) using different methods. All tested regions were within Segway/ChromHMM enhancer predictions in K562, but only ~20% were positive. DHS in the tested regions is also weak predictor of expression (green). However a gkm-SVM trained on DHS regions or Segway/ChromHMM regions is reasonably accurate (red and orange). The most accurate predictor is a gkm-SVM trained on DHS regions flanked by H3K27Ac and H3K4me1 (dark red).
Fig. 4
Fig. 4. Predicting MPRA expression in mouse retina
A) ROC and B) PRC for predicting MPRA expression in mouse retina (Shen et al., 2016). Gkm-SVM trained on either retina ATAC-seq or DHS (dark red, red) predicts the expressing constructs with about 50% precision, but gkm-SVM trained on unrelated cell types does not (melanocytes, cyan; megakaryocytes, blue; lymphoblasts, green).
Fig. 5
Fig. 5. Predicting causal SNPs within the RFX6 prostate cancer locus
deltaSVM using a gkm-SVM trained on a prostate cancer cell line LNCaP (A) can identify the causal SNP (red) from among flanking SNPs (grey), but a gkm-SVM trained on melanocytes (B) or HepG2 (C) cannot. Deepsea predictions include LNCaP cells in the training set but do not correctly identify the validated SNP (D).

References

    1. Bauer DE, Kamran SC, Lessard S, Xu J, Fujiwara Y, Lin C, Shao Z, Canver MC, Smith EC, Pinello L, Sabo PJ, Vierstra J, et al. An Erythroid Enhancer of BCL11A Subject to Genetic Variation Determines Fetal Hemoglobin Level. Science. 2013;342:253–257. - PMC - PubMed
    1. Canver MC, Smith EC, Sher F, Pinello L, Sanjana NE, Shalem O, Chen DD, Schupp PG, Vinjamur DS, Garcia SP, Luc S, Kurita R, et al. BCL11A enhancer dissection by Cas9-mediated in situ saturating mutagenesis. Nature. 2015;527:192–197. - PMC - PubMed
    1. Consortium T 1000 GP. An integrated map of genetic variation from 1,092 human genomes. Nature. 2012;491:56–65. - PMC - PubMed
    1. Emison ES, McCallion AS, Kashuk CS, Bush RT, Grice E, Lin S, Portnoy ME, Cutler DJ, Green ED, Chakravarti A. A common sex-dependent mutation in a RET enhancer underlies Hirschsprung disease risk. Nature. 2005;434:857–863. - PubMed
    1. ENCODE Consortium. An integrated encyclopedia of DNA elements in the human genome. Nature. 2012;489:57–74. - PMC - PubMed

Publication types

LinkOut - more resources