. 2016 Oct;12(10):20160432.
doi: 10.1098/rsbl.2016.0432.

Behavioural adaptations to flight into thin air

Affiliations

Behavioural adaptations to flight into thin air

Sherub Sherub et al. Biol Lett. 2016 Oct.

Abstract

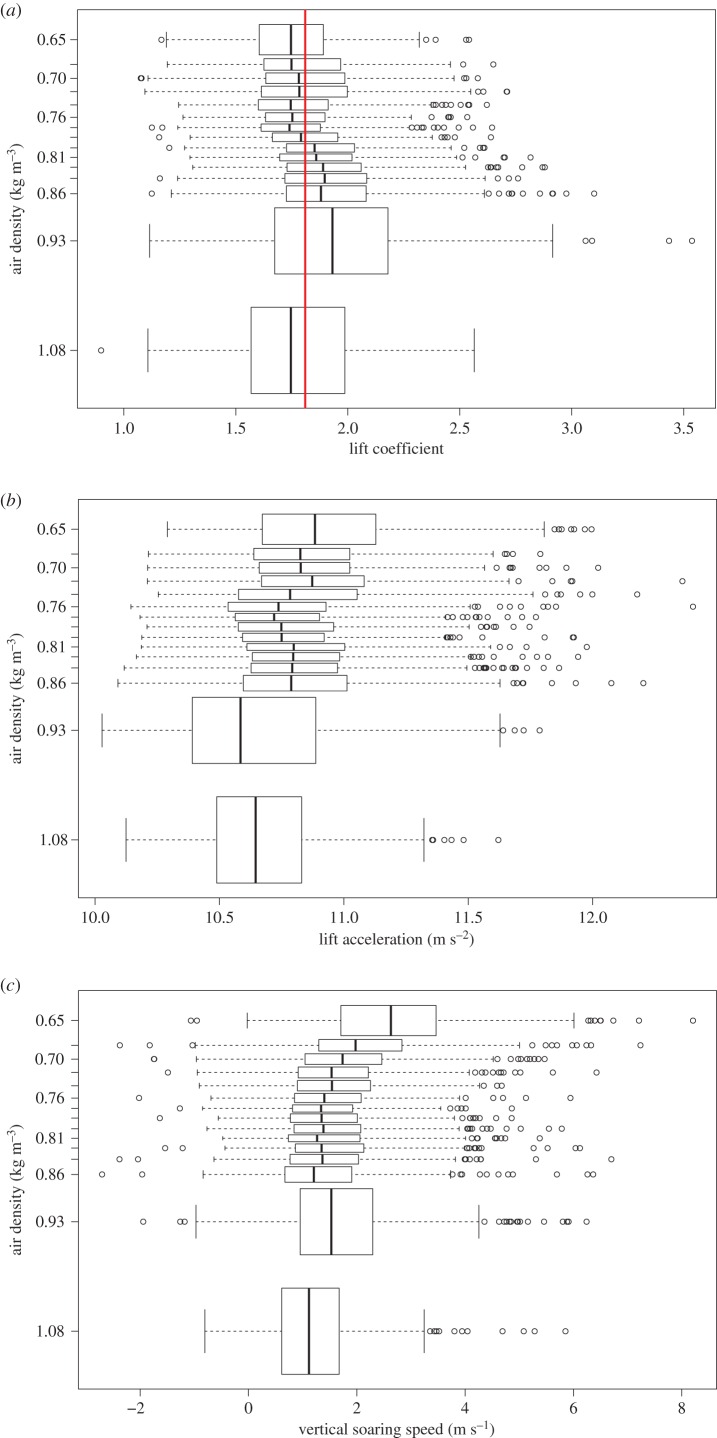
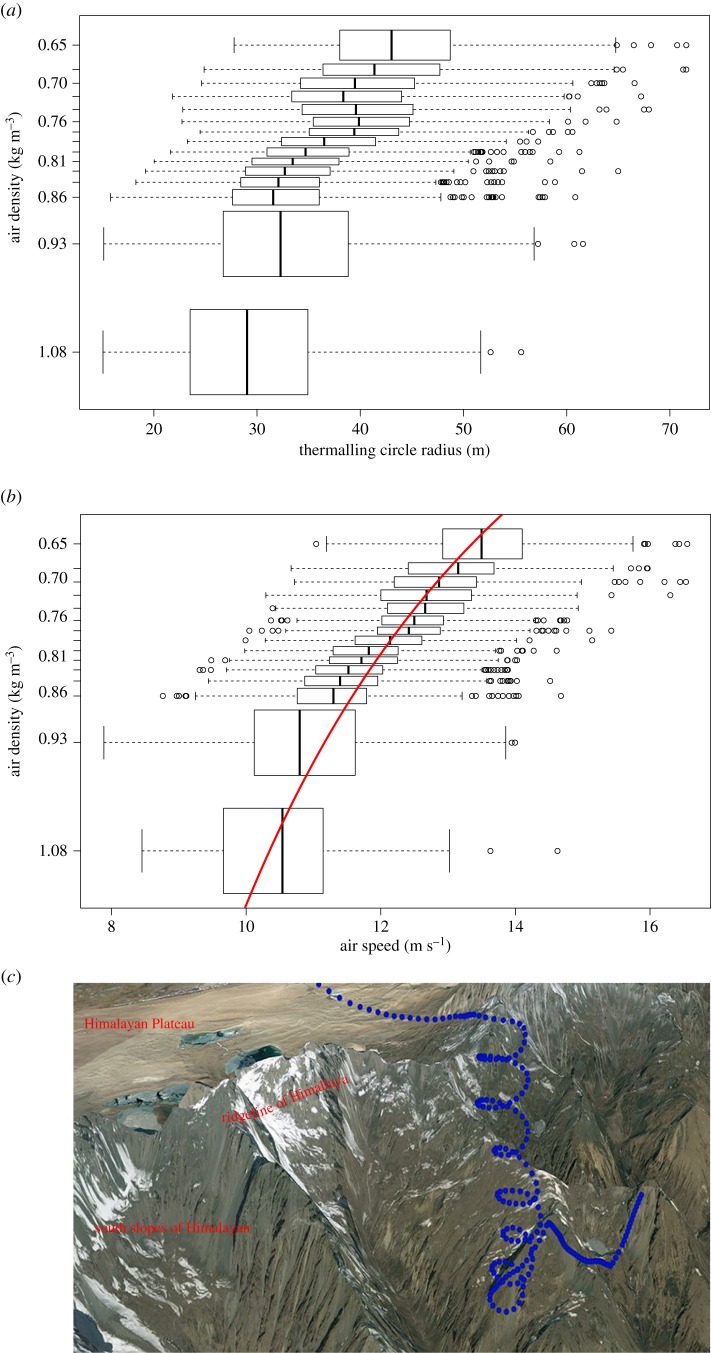
Soaring raptors can fly at high altitudes of up to 9000 m. The behavioural adjustments to high-altitude flights are largely unknown. We studied thermalling flights of Himalayan vultures (Gyps himalayensis) from 50 to 6500 m above sea level, a twofold range of air densities. To create the necessary lift to support the same weight and maintain soaring flight in thin air birds might modify lift coefficient by biophysical changes, such as wing posture and increasing the power expenditure. Alternatively, they can change their flight characteristics. We show that vultures use the latter and increase circle radius by 35% and airspeed by 21% over their flight altitude range. These simple behavioural adjustments enable vultures to move seamlessly during their annual migrations over the Himalaya without increasing energy output for flight at high elevations.

Keywords: aerodynamic; movement ecology; non-powered flight; thermalling.


Figures

Figure 1.
Figure 1.
Characteristics of acceleration at increasing elevations. (a) The vultures show small variations (−4% to +7%) in the lift coefficient over the entire flight elevation (air densities) range (red line marks the overall mean); (b) the lift acceleration varied very little with height (less than 2%); (c) the vertical soaring speed remained near constant, and even increased above 4500 m (air density less than 0.7 kg m−3). Boxes show mean (vertical line), quartile (box) and 95% (whiskers) confidence interval, as well as outliers (circles) in 15 elevation bins with equal observation numbers.
Figure 2.
Figure 2.
Behavioural changes in the flight characteristics of thermalling vultures. (a) Flight circle radius increases in relation to decreasing air density (increasing elevation). (b) Airspeed increases with elevation. Red line represents a linear model fitted to the inverse of the air density and the squared airspeed (slope = 115.7, R2 = 0.46, p < 0.0001). Data show average (vertical line), quartile (box) and 95% CI, as well as outliers (circles) in 15 elevation bins. (c) One flight segment of the vulture Yoezer. Dots mark the reported GPS locations of the vulture during flight over the Himalaya ridge. Land surface and topography obtained from GoogleEarth.

References

    1. Hawkes LA, et al. 2011. The trans-Himalayan flights of bar-headed geese (Anser indicus). Proc. Natl Acad. Sci. USA 108, 9516–9519. (10.1073/pnas.1017295108) - DOI - PMC - PubMed
    1. Butler PJ. 2010. High fliers: the physiology of bar-headed geese. Comp. Biochem. Phys. A 156, 325–329. (10.1016/j.cbpa.2010.01.016) - DOI - PubMed
    1. Nathan R, Spiegel O, Fortmann-Roe S, Harel R, Wikelski M, Getz WM. 2012. Using tri-axial acceleration data to identify behavioral modes of free-ranging animals: general concepts and tools illustrated for griffon vultures. J. Exp. Biol. 215, 986–996. (10.1242/jeb.058602) - DOI - PMC - PubMed
    1. Bishop CM, et al. 2015. The roller coaster flight strategy of bar-headed geese conserves energy during Himalayan migrations. Science 347, 250–254. (10.1126/science.1258732) - DOI - PubMed
    1. Chai P, Harrykissoon R, Dudley R. 1996. Hummingbird hovering performance in hyperoxic heliox: effects of body mass and sex. J. Exp. Biol. 199, 2745–2755. - PubMed

LinkOut - more resources