. 2017 Jan 25:7:40801.
doi: 10.1038/srep40801.

The Matrix protein M1 from influenza C virus induces tubular membrane invaginations in an in vitro cell membrane model

Affiliations

The Matrix protein M1 from influenza C virus induces tubular membrane invaginations in an in vitro cell membrane model

David Saletti et al. Sci Rep. .

Abstract

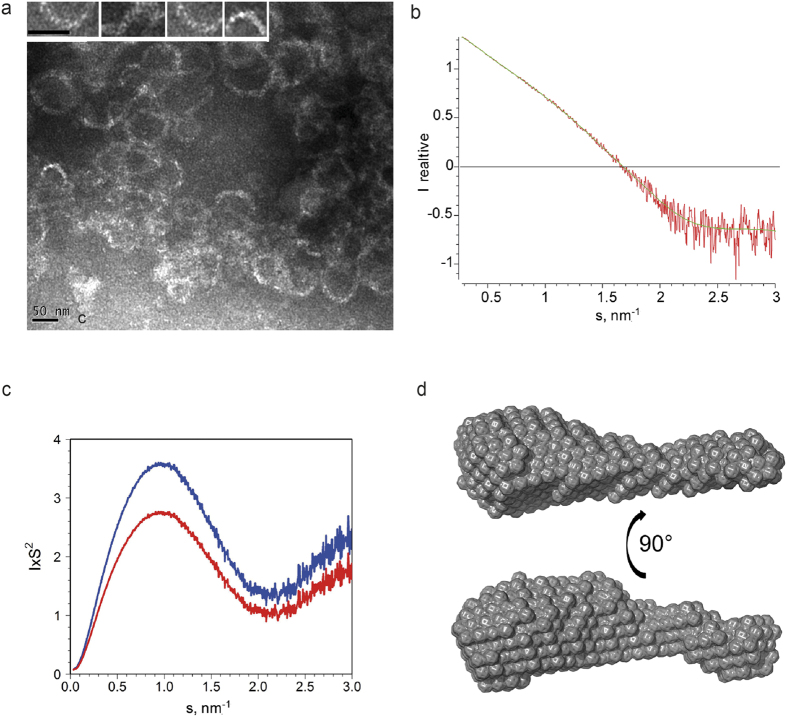
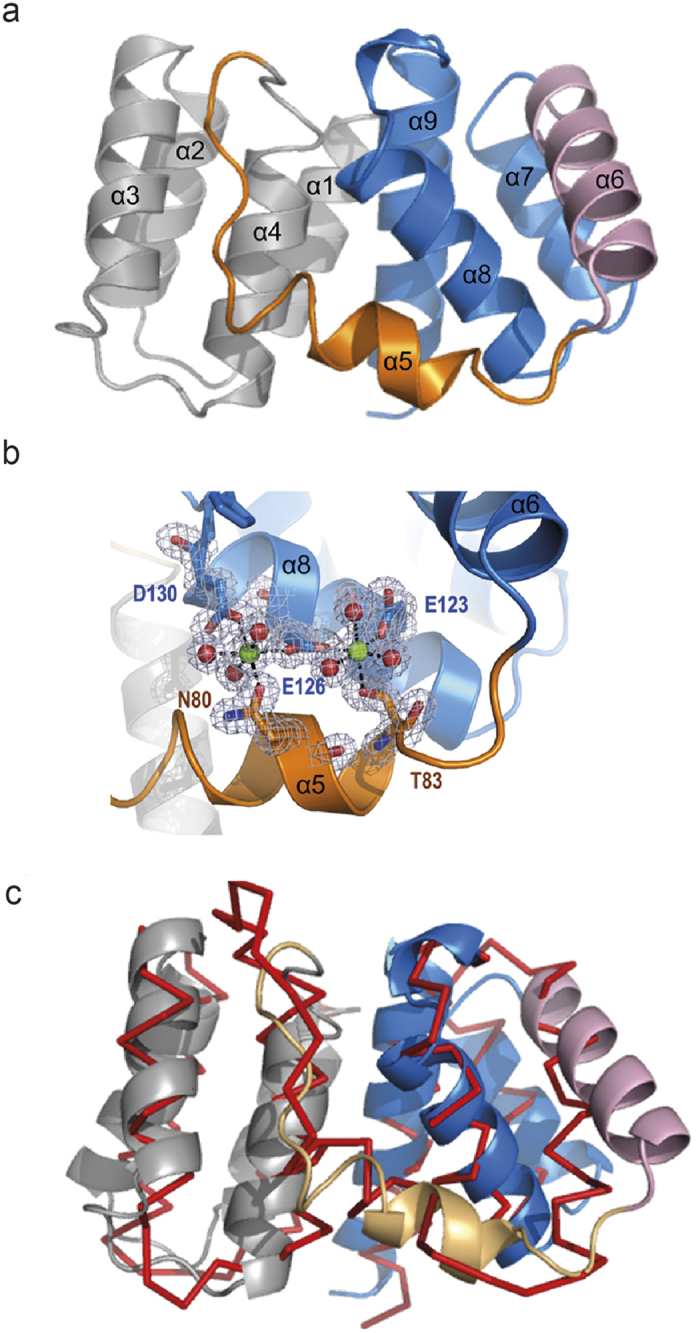
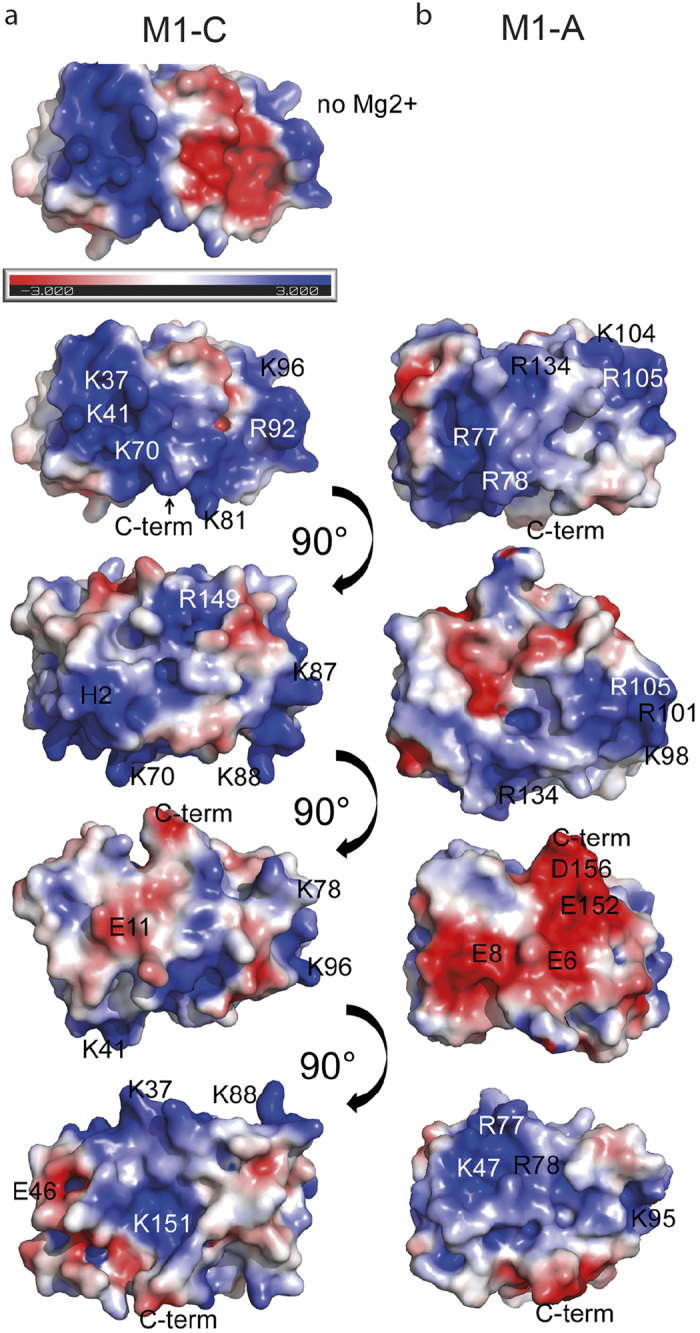
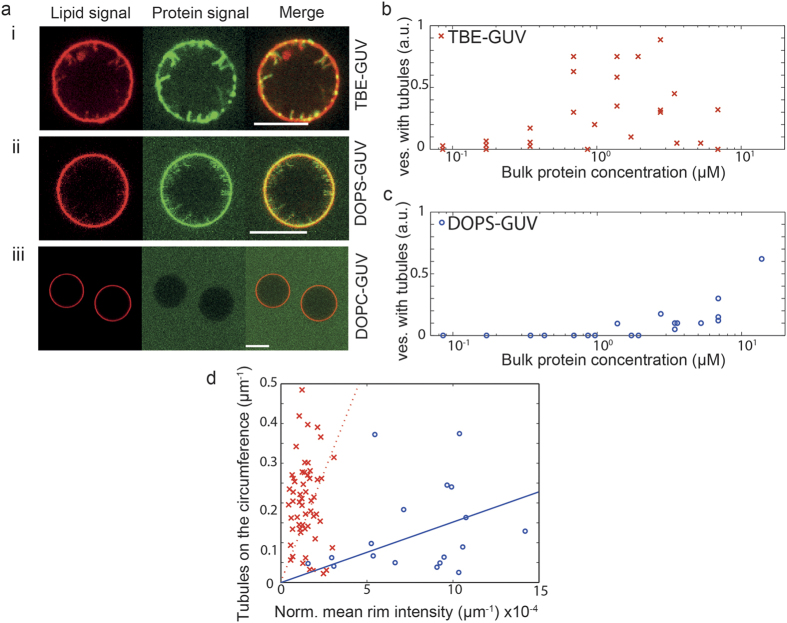
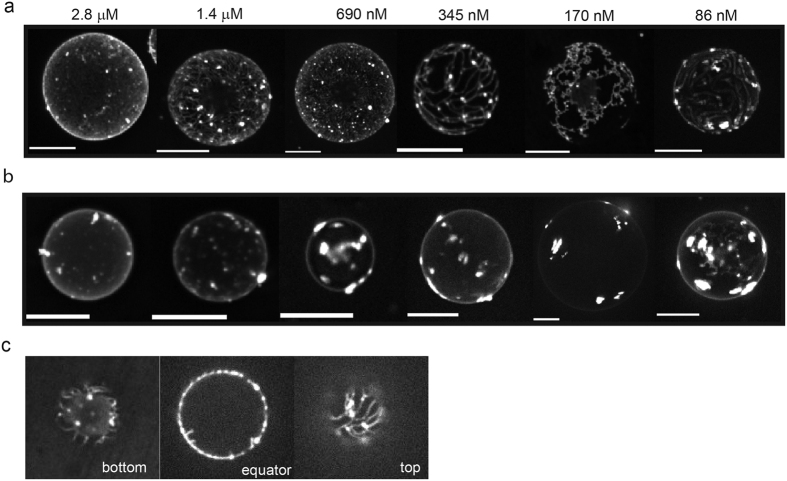
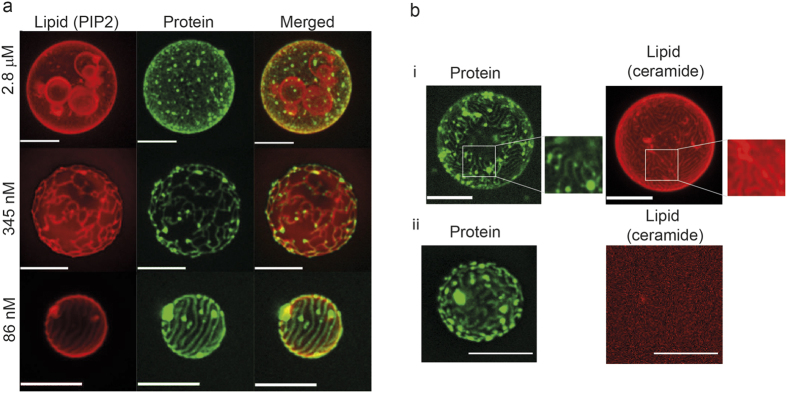
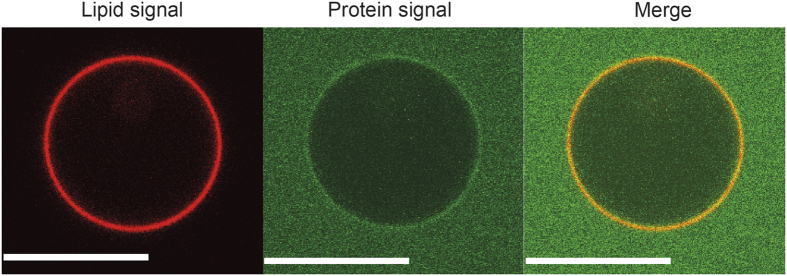
Matrix proteins from enveloped viruses play an important role in budding and stabilizing virus particles. In order to assess the role of the matrix protein M1 from influenza C virus (M1-C) in plasma membrane deformation, we have combined structural and in vitro reconstitution experiments with model membranes. We present the crystal structure of the N-terminal domain of M1-C and show by Small Angle X-Ray Scattering analysis that full-length M1-C folds into an elongated structure that associates laterally into ring-like or filamentous polymers. Using negatively charged giant unilamellar vesicles (GUVs), we demonstrate that M1-C full-length binds to and induces inward budding of membrane tubules with diameters that resemble the diameter of viruses. Membrane tubule formation requires the C-terminal domain of M1-C, corroborating its essential role for M1-C polymerization. Our results indicate that M1-C assembly on membranes constitutes the driving force for budding and suggest that M1-C plays a key role in facilitating viral egress.


Figures

Figure 1
Figure 1. Structural analysis of M1-C.
(a) M1-C forms polymers in vitro at low pH conditions as shown by negative staining electron microscopy. The width of the circular or spiral filaments is approximately 10 nm. The inset shows a close-up of some rod-like structures that associate laterally to form the filament. The scale bars are 50 nm. (b) M1-C also forms monomers at low pH conditions that produced the experimental SAXS data (red); the scattering pattern computed from the Dammin model shown in d is drawn in green. (c) Kratky plots for M1-C (red) and M1-A (blue). (d) Structural model of M1-C produced at low pH and reconstructed ab initio.
Figure 2
Figure 2. Structure of the M1-C N-terminal domain.
(a) Ribbon diagram of M1-C composed of two four-helical bundles connected by helix 5. Alpha helices are labeled. (b) Close up of the Mg2+ binding sites. M1-C binds two Mg2+ ions coordinated by residues from helices 5 and 8 and six water molecules. Alpha helices are labeled. (c) Superposing of the Cα atoms of M1-A and M1-C reveals an overall similar fold and the displacement of helix 6.
Figure 3
Figure 3. Electrostatic potential map comparison of M1-C and M1-A.
M1 has large basic surfaces. Electrostatic potential map of M1-C (a) compared to the M1-A map (b). The electrostatic potential was calculated from −3.000 KbT/ec (red) to +3.000 KbT/ec (blue).
Figure 4
Figure 4. M1-induced tubulations.
(a) Representative confocal images at the vesicles equator of (i) TBE-GUVs, (ii) DOPS-GUVs and (ii) DOPC-GUVs after incubation with M1. The red signal corresponds to bodipy-ceramide lipids incorporated into the GUV membrane and the green signal to Alexa-488 M1-C. Protein-induced membrane tubules are visible for the negatively charged vesicles of both compositions. No binding is observed in absence of negatively charged lipids. The protein concentration was 1.9 μM for the TBE-GUV experiment and 2.8 μM for the DOPS-GUVs and the DOPC-GUVs. Scale bars: 10 μm. The fraction of vesicles with tubulation in independent experiments for (b) TBE-GUVs and (c) DOPS-GUVs as a function of protein bulk concentration. (d) Tubule density at the equator as a function of the average intensity of the vesicle rim for TBE-GUVs (crosses) and DOPS-GUVs (circles) together with their respective linear fits (dotted line: TBE-GUVs; full line: DOPS-GUVs). Each data point corresponds to one analyzed vesicle and only vesicles with at least one tubule at the equator were taken into account.
Figure 5
Figure 5. M1-C clustering at the GUV surface.
Fluorescence projections of the protein signal on (a) TBE-GUVs and (b) DOPS-GUVs vesicles. For TBE-GUVs, proteins assemble into a network-like structure on the vesicle surface. For DOPS-GUVs the protein forms clusters but does not assemble into networks. A quantitative estimate of the number of clusters and network density can be found in Supplementary Fig. S4 (c) Z-stack images of a TBE-GUV vesicle incubated with 345 nM M1-C taken at the bottom (glass side) at the equator and at the top of the GUV. Scale bars: 10 μm.
Figure 6
Figure 6. Colocalization experiment using labeled lipids.
(a) Projections of TBE-GUVs with a negatively charged fluorescently-labeled lipid (Bodipy TMR PI(4,5)P2). The red signal corresponds to Bodipy TMR PI(4,5)P2 incorporated to the GUV membrane and the green signal to Alexa-488 M1-C. The negatively charged fluorescent lipids co-localize with the protein network. Scale bar: 10 μm. (b) (i) Projections of TBE-GUVs containing small amounts of bodipy-ceramide, a lipid that does not interact with M1 C. The red signal corresponds to bodipy-ceramide lipids incorporated to the GUV membrane and the green signal to Alexa-488 M1-C. In both cases, the protein bulk concentration was 1.4 μM. (ii) Control experiment using vesicles without fluorescent lipids at maximum laser power: only signal noise is detected, showing the absence of bleed-through between the fluorescence channels. Scale bar: 10 μm.
Figure 7
Figure 7. Membrane binding of the N-terminal domain of M1-C (M1C-NTD).
Confocal images at the equator of TBE-GUVs after incubation with the M1C-NTD. The red signal corresponds to bodipy-ceramide lipids incorporated to the GUV membrane and the green signal to Alexa-488 M1-C. No tubulation was observed. The protein concentration was 2.8 μM. Scale bars: 10 μm.

References

    1. McMahon H. T. & Gallop J. L. Membrane curvature and mechanisms of dynamic cell membrane remodelling. Nature 438, 590–596, doi: 10.1038/nature04396 (2005). - DOI - PubMed
    1. Rossman J. S. & Lamb R. A. Influenza virus assembly and budding. Virology 411, 229–236, doi: 10.1016/j.virol.2010.12.003 (2011). - DOI - PMC - PubMed
    1. Beigel J. H. Influenza. Crit Care Med 36, 2660–2666, doi: 10.1097/CCM.0b013e318180b039 (2008). - DOI - PMC - PubMed
    1. Matsuzaki Y. et al. Clinical features of influenza C virus infection in children. J Infect Dis 193, 1229–1235, doi: 10.1086/502973 (2006). - DOI - PubMed
    1. Homma M., Ohyama S. & Katagiri S. Age distribution of the antibody to type C influenza virus. Microbiol Immunol 26, 639–642 (1982). - PubMed

Publication types

MeSH terms

LinkOut - more resources