. 2017 Jan 25:7:41069.
doi: 10.1038/srep41069.

Kernel-based Joint Feature Selection and Max-Margin Classification for Early Diagnosis of Parkinson's Disease

Affiliations

Kernel-based Joint Feature Selection and Max-Margin Classification for Early Diagnosis of Parkinson's Disease

Ehsan Adeli et al. Sci Rep. .

Abstract

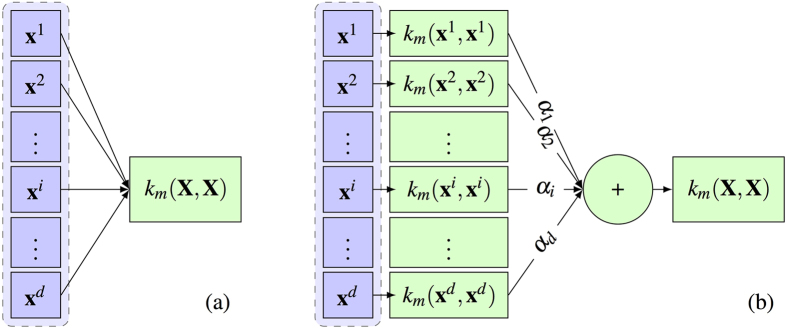
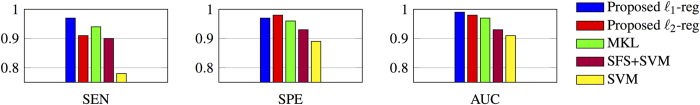
Feature selection methods usually select the most compact and relevant set of features based on their contribution to a linear regression model. Thus, these features might not be the best for a non-linear classifier. This is especially crucial for the tasks, in which the performance is heavily dependent on the feature selection techniques, like the diagnosis of neurodegenerative diseases. Parkinson's disease (PD) is one of the most common neurodegenerative disorders, which progresses slowly while affects the quality of life dramatically. In this paper, we use the data acquired from multi-modal neuroimaging data to diagnose PD by investigating the brain regions, known to be affected at the early stages. We propose a joint kernel-based feature selection and classification framework. Unlike conventional feature selection techniques that select features based on their performance in the original input feature space, we select features that best benefit the classification scheme in the kernel space. We further propose kernel functions, specifically designed for our non-negative feature types. We use MRI and SPECT data of 538 subjects from the PPMI database, and obtain a diagnosis accuracy of 97.5%, which outperforms all baseline and state-of-the-art methods.


Figures

Figure 1
Figure 1. Conventional methods (e.g., refs and 7) usually select features in the original input feature space and then learn a classifier based on the selected features (Top).
However, if a non-linear classification is intended, it is better to select the features that can best classify the data in the kernel space (Bottom). Here, formula image 
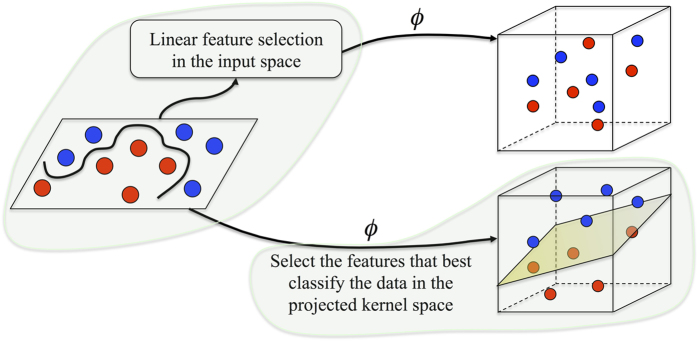
denotes a non-linear mapping function.
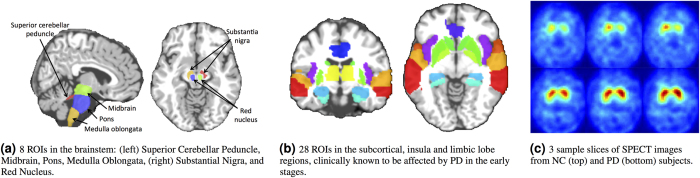
Figure 2
Figure 2. ROIs from MRI and SPECT used in this study.
Figure 3
Figure 3
(a) Conventional construction of kernel functions. (b) Kernels learned for each single feature, aggregated through the weights corresponding to each feature. km(.,.) denotes the kernel function applied on the features.
Figure 4
Figure 4. 2D t-SNE projection of the synthetic data used for evaluation of the method.
Red and Blue dots represent samples from two different classes. (a) Linearly separable data, (b) Nonlinearly separable data.
Figure 5
Figure 5. Comparisons of the sensitivity (SEN), specificity (SPE) and area under the ROC curve (AUC).
Figure 6
Figure 6. Mean weight of the features for each of the kernels, selected by our method.
The larger the mean weight, the more frequently that kernel is selected with larger weights, and thus more useful it can be.
Figure 7
Figure 7. Accuracy (ACC) and area under the ROC curve (AUC) as a function of the hyperparameter λ, as in (6).
Figure 8
Figure 8. The most frequently selected ROIs.
Figure 9
Figure 9. The magnitude of objective function in (6) (denoted as in Algorithm 1), as a function of the number of iterations required for solving the alternating optimization problem, over all 10 folds of the cross-validation experiment.
Figure 10
Figure 10. Histograms of bootstrapping for different trials, for the proposed (with -regularization) and MKL methods.
Red dashed line indicates the mean accuracy for all the trials. Our proposed method has a better mean accuracy with a tighter bound for the standard deviation.

References

    1. Yuan L., Wang Y., Thompson P. M., Narayan V. A. & Ye J. Multi-source feature learning for joint analysis of incomplete multiple heterogeneous neuroimaging data. NeuroImage 61, 622–632 (2012). - PMC - PubMed
    1. Adeli-Mosabbeb E., Thung K.-H., An L., Shi F. & Shen D. Robust feature-sample linear discriminant analysis for brain disorders diagnosis. In NIPS (2015).
    1. Thung K.-H., Wee C.-Y., Yap P.-T., Shen D. & Initiative A. D. N. Neurodegenerative disease diagnosis using incomplete multi-modality data via matrix shrinkage and completion. NeuroImage 91, 386–400 (2014). - PMC - PubMed
    1. Kerr W. T. et al.. Parameter selection in mutual information-based feature selection in automated diagnosis of multiple epilepsies using scalp EEG. In PRNI (2012). - PMC - PubMed
    1. Gu Q., Li Z. & Han J. Generalized fisher score for feature selection. In UAI (2011).

Publication types