. 2017 Jan 25:7:41163.
doi: 10.1038/srep41163.

Mechanistic insights into the impact of Cold Atmospheric Pressure Plasma on human epithelial cell lines

Affiliations

Mechanistic insights into the impact of Cold Atmospheric Pressure Plasma on human epithelial cell lines

Marlène Dezest et al. Sci Rep. .

Abstract

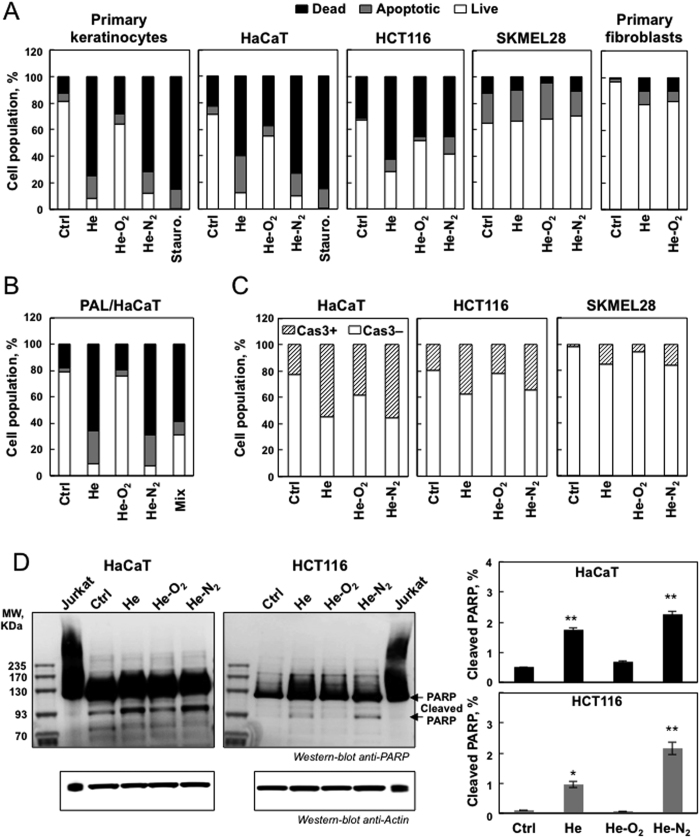
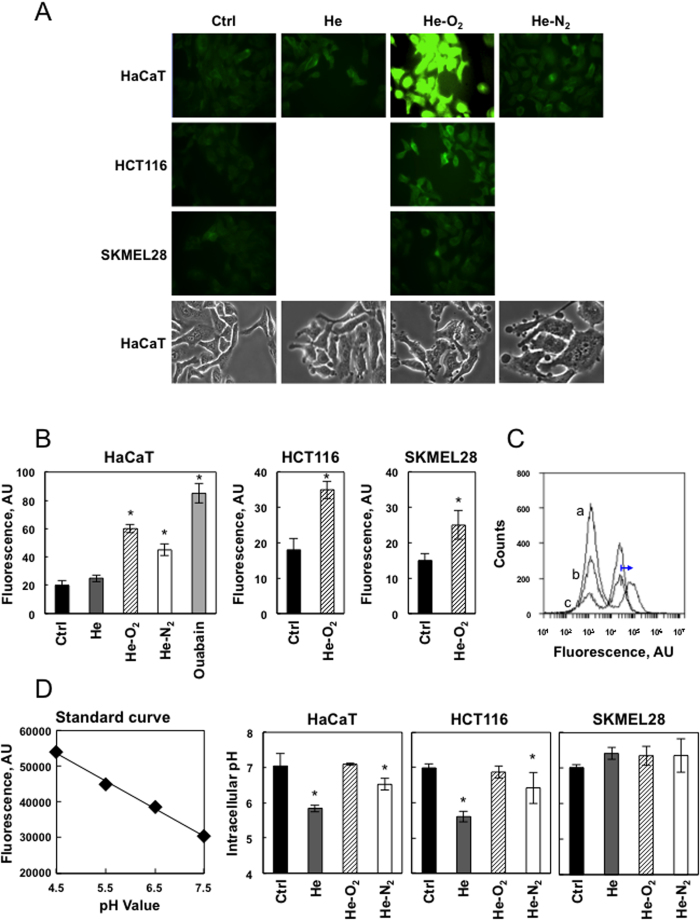
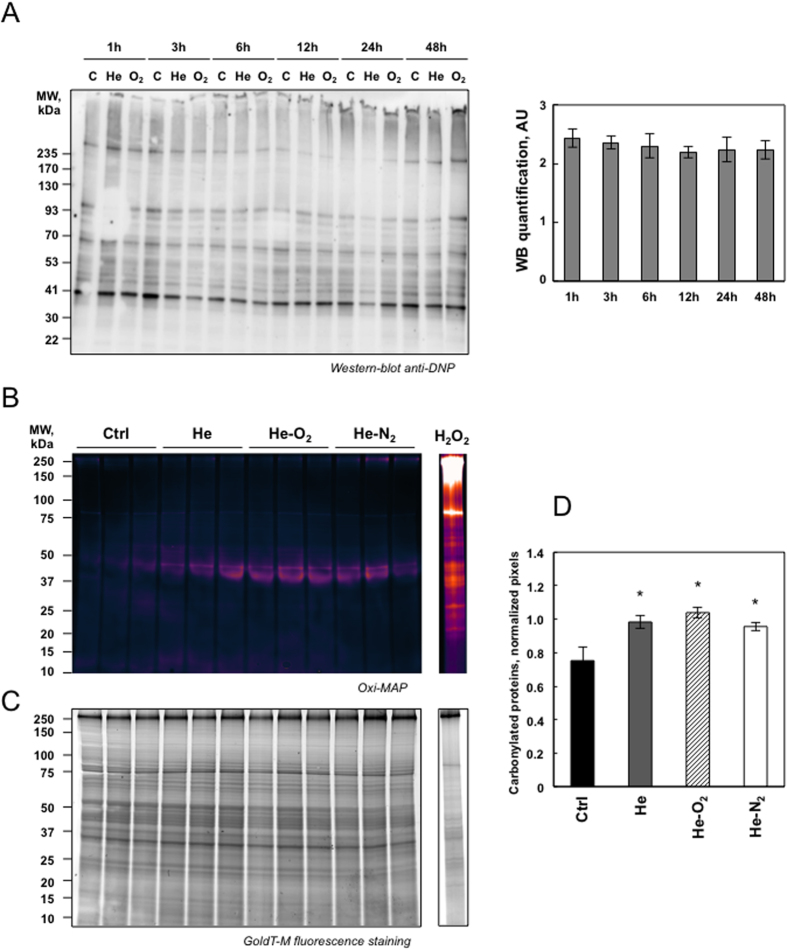
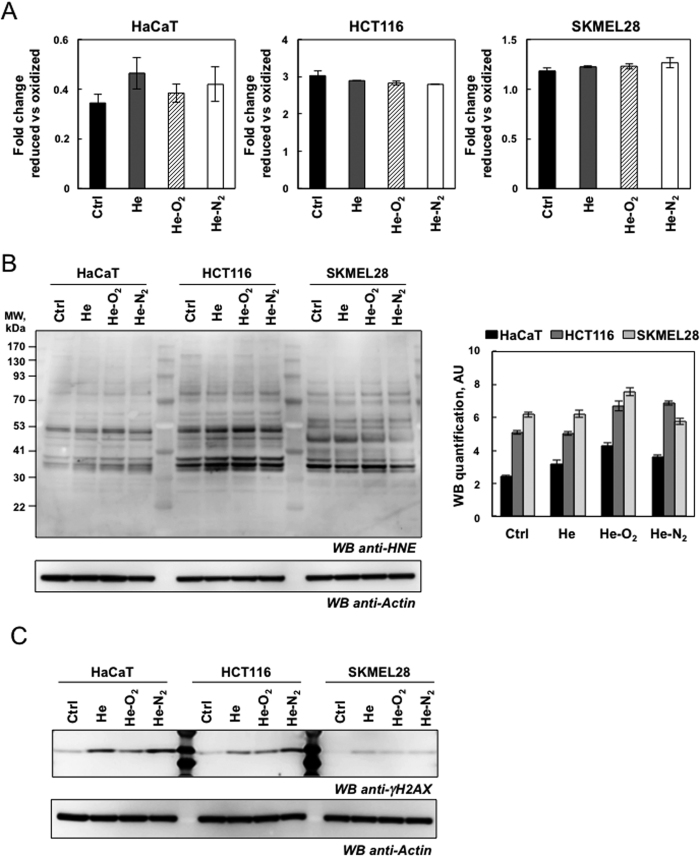
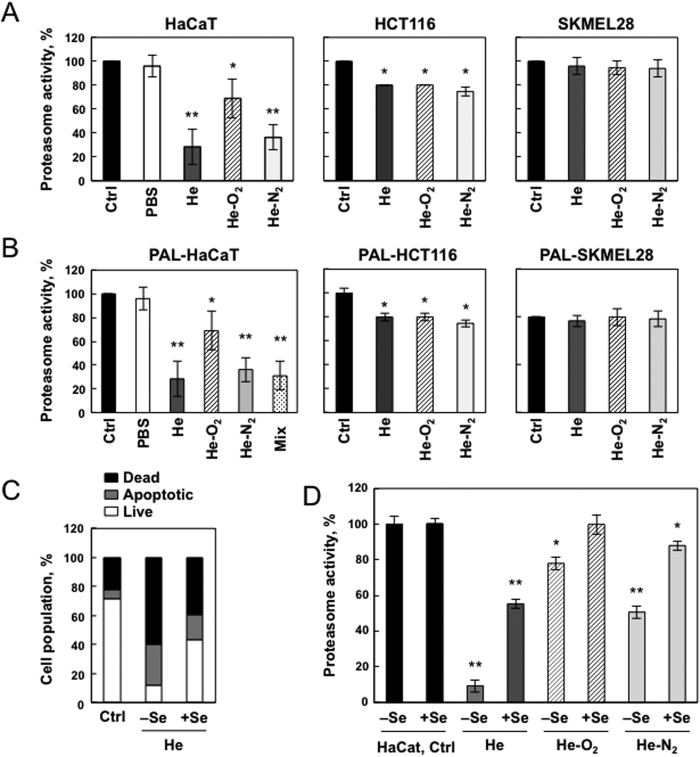
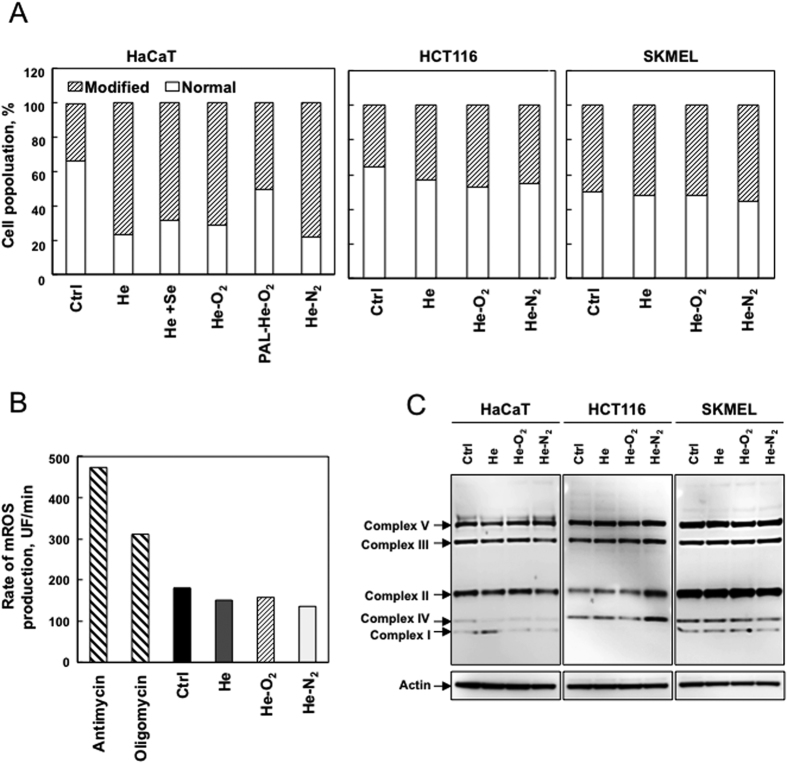
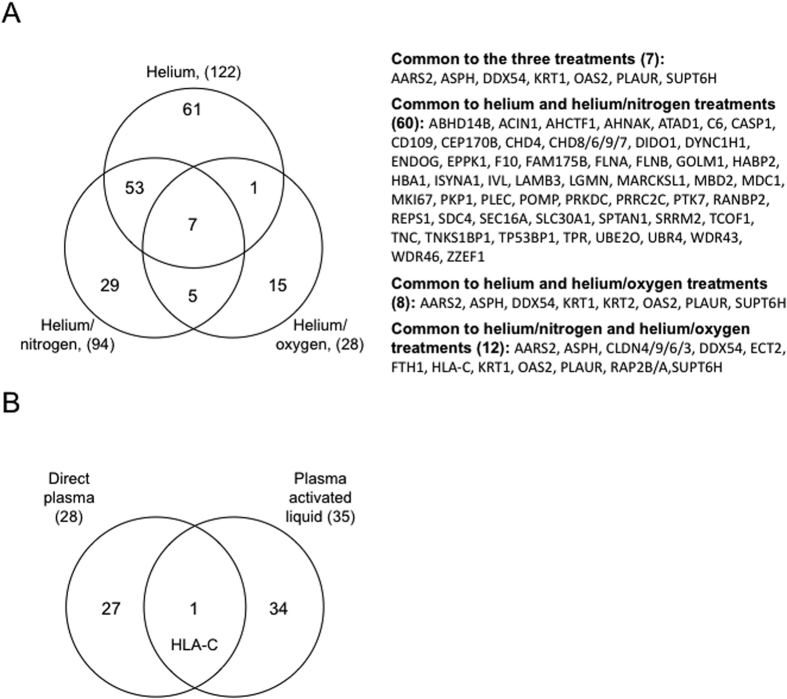
Compelling evidence suggests that Cold Atmospheric Pressure Plasma (CAPP) has potential as a new cancer therapy. However, knowledge about cellular signaling events and toxicity subsequent to plasma treatment is still poorly documented. The aim of this study was to focus on the interaction between 3 different types of plasma (He, He-O2, He-N2) and human epithelial cell lines to gain better insight into plasma-cell interaction. We provide evidence that reactive oxygen and nitrogen species (RONS) are inducing cell death by apoptosis and that the proteasome, a major intracellular proteolytic system which is important for tumor cell growth and survival, is a target of (He or He-N2) CAPP. However, RONS are not the only actors involved in cell death; electric field and charged particles could play a significant role especially for He-O2 CAPP. By differential label-free quantitative proteomic analysis we found that CAPP triggers antioxidant and cellular defense but is also affecting extracellular matrix in keratinocytes. Moreover, we found that malignant cells are more resistant to CAPP treatment than normal cells. Taken together, our findings provide insight into potential mechanisms of CAPP-induced proteasome inactivation and the cellular consequences of these events.


Figures

Figure 1
Figure 1. Differential apoptotic effects of CAPP on different types of human skin cells.
(A) Primary keratinocytes, fibroblasts, HaCaT, HCT-116 and SK-MEL-28 cells were exposed to plasma treatment (He, He-O2 and He-N2) for 5 min with 1 hr post-treatment storage. Cells were stained with Annexin V-FITC and PI and analyzed by flow cytometry 24 hr after plasma treatment. Percentage of apoptotic cells (Annexin-PI positive) was shown by histogram, staurosporine treatment was used as a control of necrotic cells. The data shown is representative of three separate cultures. (B) Effect of plasma activated liquid (PAL) on cell viability. HaCaT cells were exposed to PAL for 1 hr (PBS treated for 5 min with He plasma, 580 μM H2O2 and 300 μM NO2 measured in the PAL); He-O2 plasma (40 μM H2O2 and 50 μM NO2 measured in the PAL) and He-N2 plasma (390 μM H2O2 and 300 μM NO2 measured in the PAL) or to a mix of 580 μM hydrogen peroxide and 300 μM mM NO2, then, stained with Annexin V-FITC and PI, and analyzed by flow cytometry 24 hr after treatment. (C) For the same CAPP treatment active caspase-3 was analyzed by flow cytometry. (D) Cleaved PARP was assessed by western blot analysis. PARP cleavage was express as a % of total PARP using Jurkat cells as a control to assess native PARP. Data, mean ± SEM from three independent cultures **P < 0.01.
Figure 2
Figure 2. Effect of plasma treatment on membrane potential and cytosolic pH.
(A) Cell membrane depolarization after CAPP treatment. HaCaT, HCT-116 and SK-MEL-28 cells were loaded with FluoVoltTM membrane potential dye which exhibits higher intensity with membrane depolarization, and exposed to plasma treatment (He, He-O2 and He-N2) for 5 min and imaged. Cell morphology was monitored by phase contrast microscopy after treatment. B. Data points are mean pixel intensity ± SEM (n = 10 cells) *P < 0.05. Ouabain was used as a control for total cell depolarization. (C) Investigation of the transmembrane potential of Hacat cells by the probe DiBAC4(3) after PAL treatment. Cells were loaded with DiBAC4(3)dye which exhibits enhanced fluorescence and a red spectral shift with membrane depolarization, and exposed to PAL treatment (He, He-O2) for 1 h. Cells were analyzed by flow cytometry using valinomycin which is a potassium ionophore as a control of total cell depolarization (a, valinomycin, b, PAL-He, and c, PAL- He-O2). (D) Standard curve created using pHrodo™ Green AM with Intracellular pH Calibration Buffer Kit. HaCaT cells were incubated with 10 μM pHrodo™ Green AM for 30 min at 37 °C. The Intracellular pH Calibration Buffer Kit was used to clamp the intracellular pH with extracellular buffer at pH 4.5, 5.5, 6.5 and 7.5. Intracellular pH vs. relative fluorescence units were plotted using a microplate fluorimetric reader. HaCaT, HCT-116 and SKMEL-28 cells were loaded with pHrodo™ Green AM and exposed to plasma treatment (He, He-O2 and He-N2) for 5 min and cytosolic pH was measured. Data, mean ± SEM from three independent cultures, *P < 0.05.
Figure 3
Figure 3. Detection of oxidatively modified proteins following plasma exposure.
(A) HaCaT cells were exposed to plasma treatment (He, He-O2 and He-N2) for 5 min with 1 hr post-treatment storage and analyzed at different times after plasma treatment. To detect modified protein cells oxidatively, extracts were treated with 2, 4-dinitorphenylhydrazine to derivatize protein carbonyls and then evaluated by Western-blot analysis using 2, 4-dinitrophenyl antibodies and the blot were quantified using Image J. (B) Fluorescent detection of oxidized proteins. HaCaT cells were exposed to plasma treatment (He, He-O2 and He-N2) for 5 min with 1 hr post-treatment storage and analyzed at 24 hr after plasma treatment. Cells were lyzed and evaluated by SDS-PAGE (4–20%) pattern of carbonylated proteins pre-labeled with C5Hz. As a positive control, HaCaT cells were treated with 500 μM H2O2 for 1 hr and analyzed 24 hr later. (C) Total proteins post-stained with ProteinGOLDTM. (D) Semi-quantification of carbonylated proteins were performed by densitometric analysis, expressed as relative values (normalization to total protein) and shown as mean ± S.D (n = 3) and analyzed using Student’s t-test; *P < 0.05.
Figure 4
Figure 4. Detection of lipid peroxidation and DNA damage following plasma exposure.
(A) Lipid peroxidation detection with Image-iT® Peroxidation Kit. HaCaT, HCT-116 and SK-MEL-28 cells were stained with 10 μM Lipid Peroxidation Sensor for 30 min and exposed to plasma treatment (He, He-O2 and He-N2) for 5 min with 1 hr post-treatment and analyzed after plasma treatment with a microplate fluorimetric reader. In control cells, most of the signal is in the red channel and the ratio of 590/510 is high, data, mean ± SEM from three independent cultures (B) HaCaT, HCT-116 and SKMEL-28 cells were exposed to plasma treatment (He, He-O2 and He-N2) for 5 min with 1 hr post-treatment and analyzed 24hr after plasma treatment. Lipid peroxidation was detected by immunoblotting against 4-hydroxy-nonenal using whole-cell lysates (n = 3). Actin was used as loading control for quantification. (C) For the same CAPP treatment DNA damage was evaluated by western blot analysis using polyclonal antibody against Phospho-Histone H2AX, whole-cell lysates.
Figure 5
Figure 5. Proteasome inactivation following plasma exposure.
(A) HaCaT, HCT-116 and SK-MEL-28 cells were exposed to plasma treatment (He, He-O2 and He-N2) for 5 min with 1 hr post-treatment storage. Proteasome chymotrypsin-like activity was measured 24 hr post treatment using the fluorogenic peptide LLVY-AMC. Proteasome activity is presented as a percent of non-treated cells. Data, mean ± SEM from three independent cultures, *P < 0.05; **P < 0.01. (B) Effect of plasma activated liquid (PAL) on cell proteasome activity. HaCaT, HCT-116 and SK-MEL-28 cells were exposed to PAL for 1 hr (PBS treated for 5 min with He plasma (580 μM H2O2 and 300 μM NO2 measured in the PAL); He-O2 plasma (40 μM H2O2 and 50 μM NO2 measured in the PAL) and He-N2 plasma (390 μM H2O2 and 300 μM NO2 measured in the PAL) or to a mix of 580 μM hydrogen peroxide and 300 μM mM NO2 for HaCAT cells and proteasome activity was measured 24 hr post treatment. Data, mean ± SEM from three independent cultures, *P < 0.05; **P < 0.01. (C) Effect of glutathione peroxidase overexpression on apoptosis following plasma treatment. HaCaT cells were grown in medium depleted or supplemented in Selenium (Se), a condition which is known to increase glutathione peroxidase activity and were exposed to He-plasma treatment for 5 min with 1 hr post-treatment storage. Cells were stained with Annexin V-FITC and PI and analyzed by flow cytometry 24 hr after plasma treatment. Percentage of apoptotic cells (Annexin-PI positive) was shown by histogram. (D) Effect of glutathione peroxidase activation on proteasome activity following plasma treatment. HaCaT cells were grown in medium depleted or supplemented in Selenium (Se), a condition which is known to increase glutathione peroxidase activity and expression and then exposed to CAPP treatment (He, He-O2 and He-N2) for 5 min with 1 hr post-treatment storage. Proteasome activity was measured 24 hr post treatment. Data, mean ± SEM from three independent cultures, *P < 0.05; **P < 0.01.
Figure 6
Figure 6. Collapse of the mitochondrial transmembrane potential without ROS production following plasma treatment.
(A) HaCaT cells were grown in normal or medium supplemented in Selenium (Se), a condition which is known to increase glutathione peroxidase activity and expression, HCT-116 and SK-MEL-28 cells were exposed to plasma treatment (He, He-O2 and He-N2) for 5 min with 1 hr post-treatment storage. Hacat cells were also exposed to PAL for 1 hr, PBS treated for 5 min with He-O2 plasma (40 μM H2O2 and 50 μM NO2 measured in the PAL). Mitochondrial membrane potential was measured using JC-1 by flow cytometry 24 hr post treatment and expressed as a percent of cells with a normal membrane potential. The data shown is representative of three separate cultures. (B) For the same CAPP treatment, rate of superoxide production was measured in HaCaT cells by flow cytometry using MitoSox. Antimycin (4 μg/ml) and oligomycin (1 μg/ml) induced a significant increase in mitochondrial ROS (mROS) production and were used as positive controls. (C) Immunoblot analysis of OXPHOS complexes (CI to CV) protein levels in cells following the same CAPP treatment, with actin as a loading control. The data shown is representative of three separate cultures.
Figure 7
Figure 7. Venn diagram of proteins of varying abundance after various plasma treatments.
(A) HaCaT cells were exposed to plasma treatment (He, He-O2 and He-N2) for 5 min with 1 hr post-treatment storage and analyzed at 24 hr after plasma treatment. Total protein extracts were analyzed nanoLC–MS/MS after trypsin digestion. Differential label-free quantitative analyses between treatment and control were performed. (B) Venn diagram of proteins of varying abundance after direct plasma or plasma activated liquid treatments. HaCaT cells were exposed to He-O2 plasma for 5 min with 1 hr post-treatment storage or PAL for 1 hr (PBS treated for 5 min by He-O2 plasma) and analyzed at 24 hr after plasma treatment. Total protein extracts were analyzed by nanoLC–MS/MS after trypsin digestion. Differential label-free quantitative analyses between treatment and control were performed.

References

    1. Vandamme M. et al.. ROS implication in a new antitumor strategy based on non-thermal plasma. Int J Cancer 130, 2185–2194, doi: 10.1002/ijc.26252 (2012). - DOI - PubMed
    1. Dobrynin D., Fridman G., Friedman G. & Fridman A. Physical and biological mechanisms of direct plasma interaction with living tissue. New Journal of Physics 11, 115020, doi: 10.1088/1367-2630/11/11/115020 (2009). - DOI
    1. von Woedtke T., Reuter S., Masur K. & Weltmann K. D. Plasmas for medicine. Physics Reports 530, 291–320, doi: 10.1016/j.physrep.2013.05.005 (2013). - DOI
    1. Wende K. et al.. Identification of the biologically active liquid chemistry induced by a nonthermal atmospheric pressure plasma jet. Biointerphases 10, 029518, doi: 10.1116/1.4919710 (2015). - DOI - PubMed
    1. Park S. B. et al.. Differential Epigenetic Effects of Atmospheric Cold Plasma on MCF-7 and MDA-MB-231 Breast Cancer Cells. PLoS One 10, e0129931, doi: 10.1371/journal.pone.0129931 (2015). - DOI - PMC - PubMed

Publication types