. 2017 Jan 25;12(1):e0170806.
doi: 10.1371/journal.pone.0170806. eCollection 2017.

The Effect of Tacrolimus and Mycophenolic Acid on CD14+ Monocyte Activation and Function

Affiliations

The Effect of Tacrolimus and Mycophenolic Acid on CD14+ Monocyte Activation and Function

Nynke M Kannegieter et al. PLoS One. .

Abstract

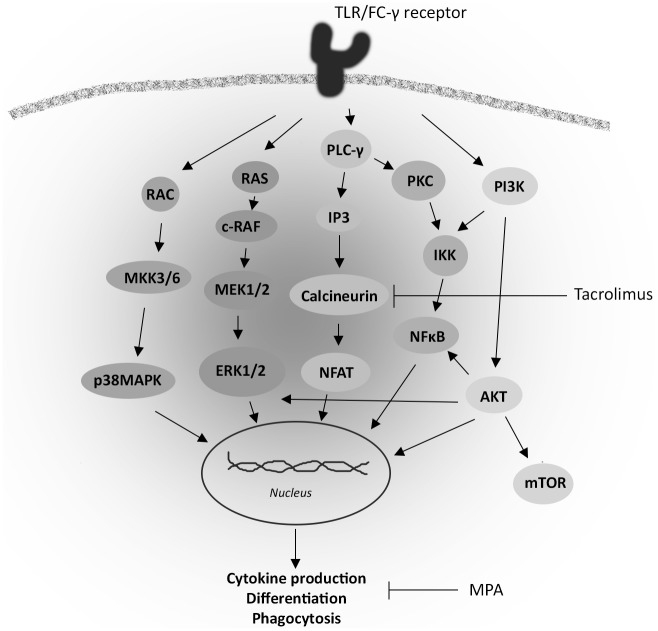
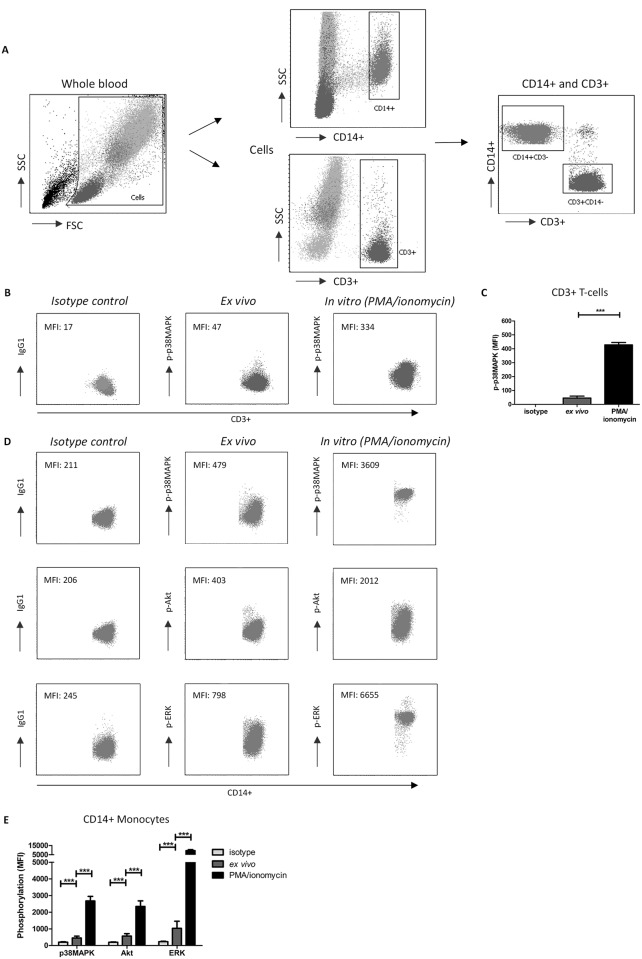
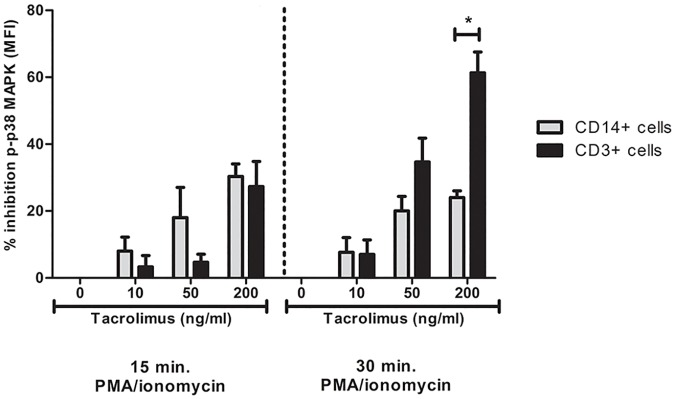
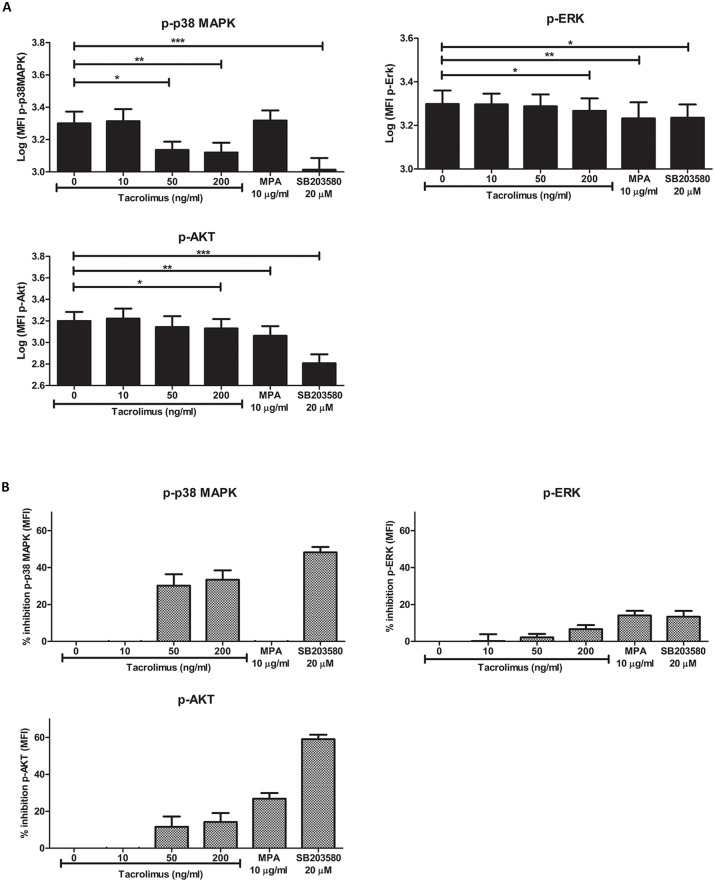
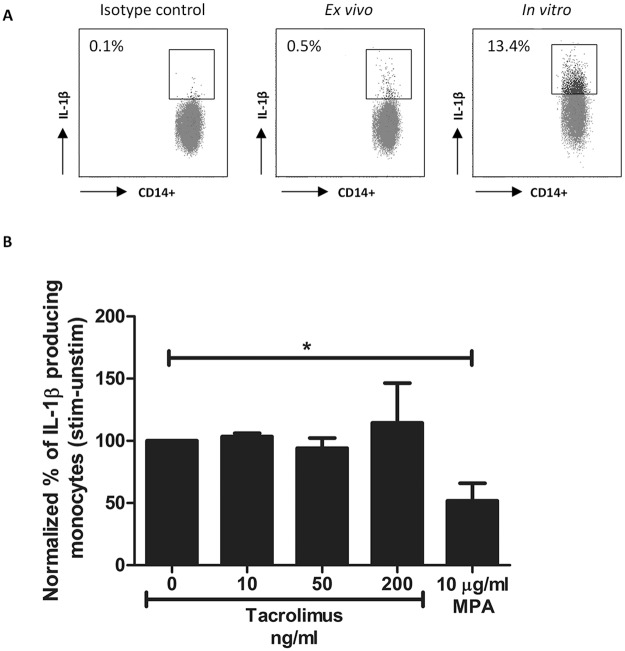
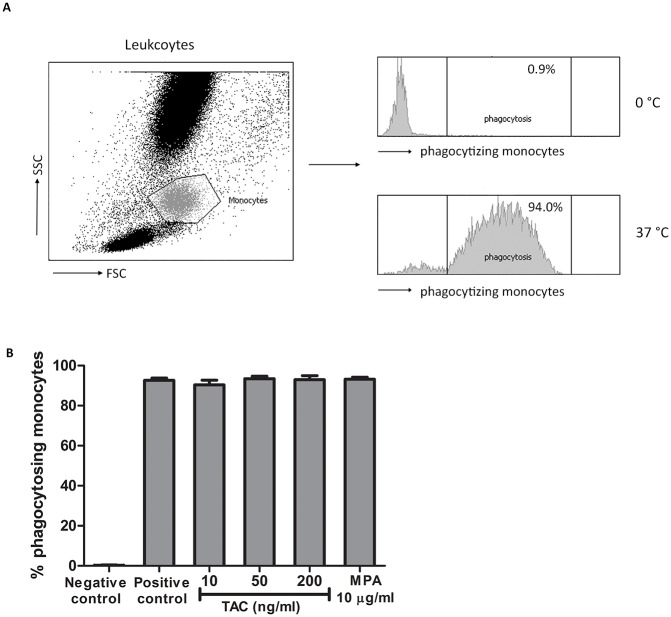
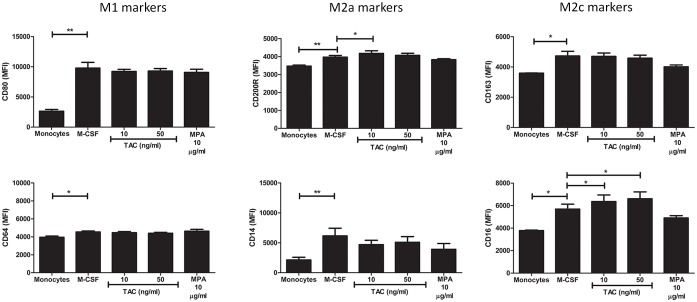
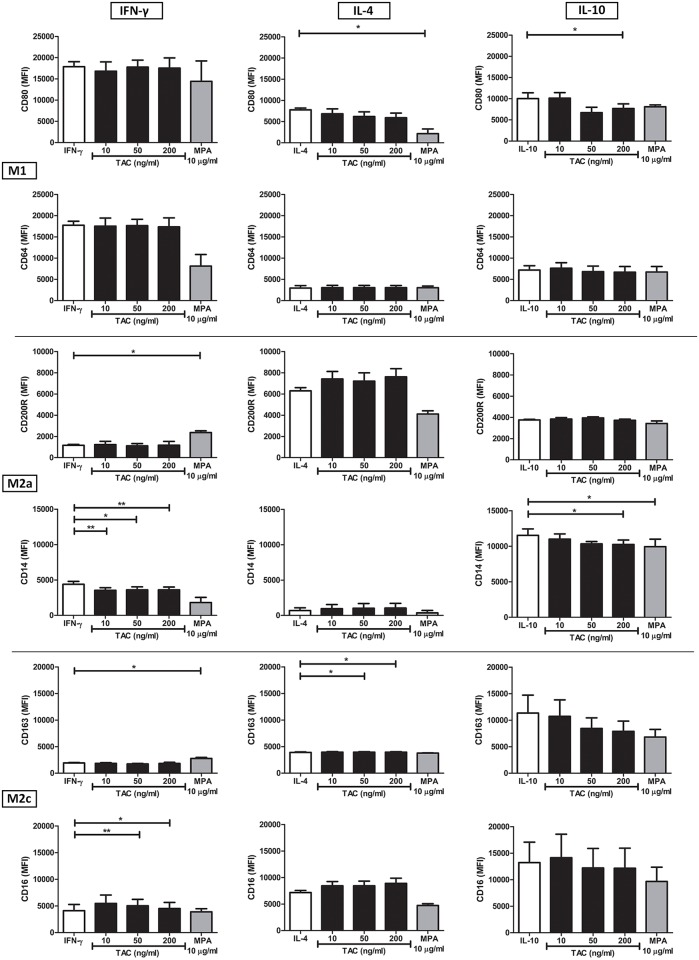
Monocytes and macrophages play key roles in many disease states, including cellular and humoral rejection after solid organ transplantation (SOT). To suppress alloimmunity after SOT, immunosuppressive drug therapy is necessary. However, little is known about the effects of the immunosuppressive drugs tacrolimus and mycophenolic acid (MPA) on monocyte activation and function. Here, the effect of these immunosuppressants on monocytes was investigated by measuring phosphorylation of three intracellular signaling proteins which all have a major role in monocyte function: p38MAPK, ERK and Akt. In addition, biological functions downstream of these signaling pathways were studied, including cytokine production, phagocytosis and differentiation into macrophages. To this end, blood samples from healthy volunteers were spiked with diverse concentrations of tacrolimus and MPA. Tacrolimus (200 ng/ml) inhibited phosphorylation of p38MAPK by 30% (mean) in CD14+ monocytes which was significantly less than in activated CD3+ T cells (max 60%; p < 0.05). This immunosuppressive agent also partly inhibited p-AKT (14%). MPA, at a therapeutic concentration showed the strongest effect on p-AKT (27% inhibition). p-ERK was inhibited with a maximum of 15% after spiking with either tacrolimus or MPA. The production of IL-1β and phagocytosis by monocytes were not affected by tacrolimus concentrations, whereas MPA did inhibit IL-1β production by 50%. Monocyte/macrophage polarization was shifted to an M2-like phenotype in the presence of tacrolimus, while MPA increased the expression of M2 surface markers, including CD163 and CD200R, on M1 macrophages. These results show that tacrolimus and MPA do not strongly affect monocyte function, apart from a change in macrophage polarization, to a clinically relevant degree.


Conflict of interest statement

I have read the journal's policy and the authors of this manuscript have the following competing interests: D.A. Hesselink has received lecture fees and grant support from Astellas Pharma. This does not alter our adherence to PLOS ONE policies on sharing data and materials.

Figures

Fig 1
Fig 1. Simplified overview of intracellular signaling pathways involved in monocyte activation.
After toll like receptor (TLR) or FC-γ receptor activation the MAPK, Akt and NFAT pathways are activated upstream. The phosphorylation of the intracellular signaling proteins leads to the activation of transcription factors, such as CREB and NF-κB p65, which after activation leads to gene transcription. This process determines the function of monocytes including phenotypic differentiation, cytokine production and phagocytosis.
Fig 2
Fig 2. Gating strategy for the selection of monocytes and T-cells, and the measurement of p38MAPK, ERK and Akt phosphorylation.
(A) Scatter dot plots to define the monocyte population in blood samples from healthy controls. Cells were selected in whole blood samples for each healthy control and then gated for their expression of either CD3 or CD14. Then, CD3+ and CD14+ cells were combined in one dotplot, to make sure that there were no double positive cells in the analysis. (B) An example of p38MAPK phosphorylation in CD3+ T cells, measured as the median fluorescence intensity (MFI) prior to (ex vivo) or after stimulation with PMA/ionomycin (in vitro) compared to the isotype control. (C) p38MAPK phosphorylation in CD3+ T-cells was increased after stimulation with PMA/ionomycin compared to isotype controls and ex vivo (unstimulated) samples. (D) Examples of the phosphorylation of p38MAPK, Akt and ERK in CD14+ monocytes of isotype controls, ex vivo (unstimulated) and PMA/Ionomycin stimulated (in vitro) samples. (E) Phosphorylation (MFI) of p38MAPK, Akt and ERK in CD14+ monocytes is increased after PMA/ionomycin stimulation compared to isotype controls and ex vivo samples and showed the maximum phosphorylation capacity for each protein. FSC, forward scatter; SSC, side scatter; MFI, median fluorescence intensity. (Data are plotted as the mean ±SEM; n = 5.)
Fig 3
Fig 3. p38MAPK phosphorylation is inhibited more in T-cells than in monocytes.
Blood samples from healthy volunteers were spiked with either vehicle, 10 ng/ml tacrolimus, 50 ng/ml tacrolimus or 200 ng/ml tacrolimus. Thereafter, the phosphorylation of p38MAPK was determined in T-cells and monocytes after 15 or 30 min. of stimulation with PMA/ionomycin. After 30 min. stimulation, T-cells were significantly more inhibited than monocytes. (Data are plotted as the mean ±SEM; n = 3) *) p < 0.05; **) p < 0.01; ***) p < 0.001.
Fig 4
Fig 4. Tacrolimus and MPA can inhibit signaling pathway activation in whole-blood samples.
(A) Phospho-p38MAPK (upper left panel), p-ERK (upper right panel) and p-Akt (lower panel) phosphorylation in monocytes was measured as MFI level. Blood samples from healthy volunteers were spiked with vehicle, 10 ng/ml tacrolimus, 50 ng/ml tacrolimus, 200 ng/ml tacrolimus, 10 μg/ml MPA or 20 μM of the MAPK inhibitor SB203580. The effect of tacrolimus and MPA was based on the stimulated samples without the addition of drugs. The MAPK inhibitor was used as a positive control. Gating was performed according to Fig 2. Tacrolimus was found to have an effect on p38MAPK, ERK and Akt phosphorylation. Akt and ERK phosphorylation was decreased in the presence of MPA. (B) Percentages of inhibition for the phosphorylation of p38MAPK (upper left panel), ERK (upper right panel) and Akt (lower panel). Data are normalized for the MFI values of the stimulated samples without the addition of immunosuppressive drugs. (Data are plotted as the mean ±SEM; n = 5) *) p < 0.05; **) p < 0.01; ***) p < 0.001.
Fig 5
Fig 5. IL-1β production by monocytes of healthy controls is suppressed in the presence of MPA but not in the presence of tacrolimus.
(A) Dot plots showing IL-β production with or without stimulation in monocytes. Cells were gated of whole blood samples according to Fig 2a. Isotype controls were used as negative controls and were used to set the gate for the positive IL-1β expression. Results are shown as the percentage of IL-1β producing monocytes compared to the isotype control. Samples were stimulated with PMA/ionomycin for maximum production of IL-1β. (B) Mean percentages of IL-1β producing monocytes after spiking with vehicle, 10 ng/ml tacrolimus, 50 ng/ml tacrolimus or 10 μg/ml MPA. Samples were corrected for the unstimulated results and then normalized to the samples without drug exposure. IL-1β production in monocytes was significantly suppressed by a concentration of 10 μg/ml MPA. (Data are plotted as the mean ±SEM; n = 5) *) p < 0.05.
Fig 6
Fig 6. The percentage of phagocytosis by monocytes from healthy controls was not changed in the presence of tacrolimus or MPA.
(A) Monocytes were selected from the leukocyte population by a forward and side scatter. Analysis was based on the phagocytosis of the FITC-labeled bacteria. Incubation with FITC-labeled bacteria on 37°C showed a high percentage of phagocytosing monocytes (positive control) compared to monocytes on 0°C (negative control). (B) Mean percentage of phagocytosing monocytes after spiking with either vehicle, 10 ng/ml tacrolimus, 50 ng/ml tacrolimus, 200 ng/ml tacrolimus or 10 μg/ml MPA. Incubation at 37°C increased the percentage of phagocytosing monocytes by more than 90%. Effects of tacrolimus and MPA on phagocytosis were determined as the percentage of phagocytosing monocytes compared to the positive control without immunosuppressive drugs. (Data are plotted as the mean ±SEM; n = 4).
Fig 7
Fig 7. Monocyte differentiation in the presence of tacrolimus and MPA causes a small shift in macrophages subsets.
CD14+ monocytes were freshly isolated from whole blood samples of healthy volunteers (n = 5) and then cultured for 4 days with either vehicle, 10 ng/ml tacrolimus, 50 ng/ml tacrolimus, 200 ng/ml tacrolimus or 10 μg/ml MPA. The addition of cytokines was used a positive control. Differentiated macrophages were gated based on their location on the forward sideward scatter. After 4 days of culturing, the expression of all tested surface markers was increased compared to freshly isolated monocytes. The addition of tacrolimus, but not MPA, resulted in an increase of the expression of M2 markers (CD16 and CD200R). (Data are plotted as the mean ±SEM; n = 5 *) p < 0.05; **) p < 0.01; ***) p < 0.001.
Fig 8
Fig 8. MPA and tacrolimus act differentially on the polarization of M1 and M2 macrophages.
CD14+ isolated monocytes were cultured for 4 days in the presence of either M-CSF and IFN-γ (left graphs), M-CSF and IL-4 (middle graphs) or M-CSF and IL-10 (right graphs). In addition, vehicle, 10 ng/ml tacrolimus, 50 ng/ml tacrolimus, 200 ng/ml tacrolimus or 10 μg/ml MPA were added to each culture condition. Tacrolimus changed the expression of M2 markers under a M1-driven condition and decreases the expression of M1 markers under M2 conditions. MPA reduced the expression of CD80 under a M2 inducing condition and increased M2 expression under IFN-γ stimulation. (Data are plotted as the mean ±SEM n = 3 *) p < 0.05; **) p < 0.01; ***) p < 0.001.

Similar articles

Cited by

References

    1. Rowshani AT, Vereyken EJ. The role of macrophage lineage cells in kidney graft rejection and survival. Transplantation. 2012;94(4):309–18. 10.1097/TP.0b013e318250c10f - DOI - PubMed
    1. Nagata Y, Fujimoto M, Nakamura K, Isoyama N, Matsumura M, Fujikawa K, et al. Anti-TNF-α Agent Infliximab and Splenectomy Are Protective Against Renal Ischemia-Reperfusion Injury. Transplantation. 2016;100(8):1675–82. 10.1097/TP.0000000000001222 - DOI - PubMed
    1. Girlanda R, Kleiner DE, Duan Z, Ford EA, Wright EC, Mannon RB, et al. Monocyte infiltration and kidney allograft dysfunction during acute rejection. Am J Transplant. 2008;8(3):600–7. 10.1111/j.1600-6143.2007.02109.x - DOI - PMC - PubMed
    1. Kraaij MD, Vereyken EJ, Leenen PJ, van den Bosch TP, Rezaee F, Betjes MG, et al. Human monocytes produce interferon-gamma upon stimulation with LPS. Cytokine. 2014;67(1):7–12. 10.1016/j.cyto.2014.02.001 - DOI - PubMed
    1. Grigoryev YA, Kurian SM, Avnur Z, Borie D, Deng J, Campbell D, et al. Deconvoluting post-transplant immunity: cell subset-specific mapping reveals pathways for activation and expansion of memory T, monocytes and B cells. PLoS One. 2010;5(10):e13358 10.1371/journal.pone.0013358 - DOI - PMC - PubMed

MeSH terms