. 2017 Jan 24;112(2):376-387.
doi: 10.1016/j.bpj.2016.12.013.

The Relaxation Properties of Myofibrils Are Compromised by Amino Acids that Stabilize α-Tropomyosin

Affiliations

The Relaxation Properties of Myofibrils Are Compromised by Amino Acids that Stabilize α-Tropomyosin

Beatrice Scellini et al. Biophys J. .

Abstract

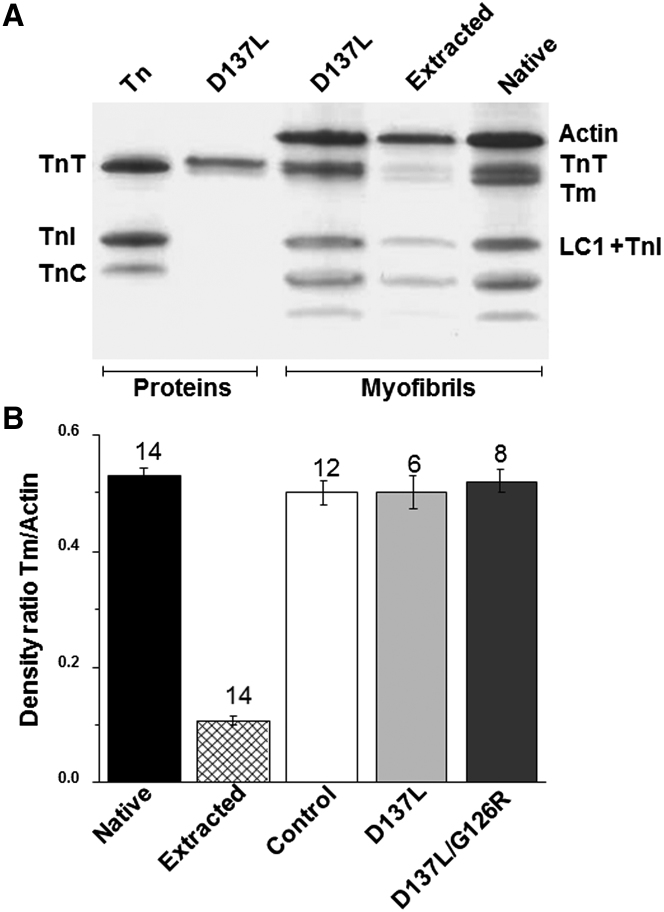
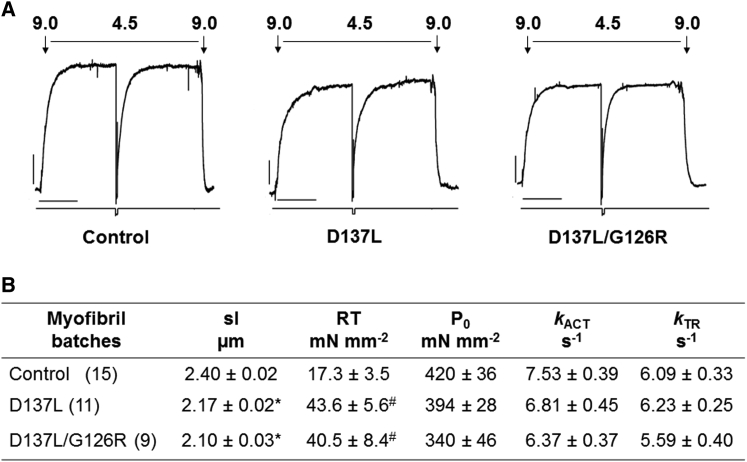
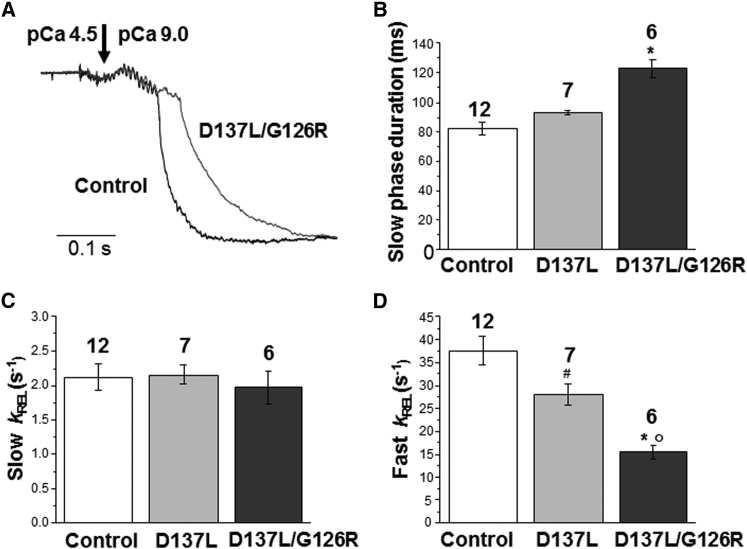
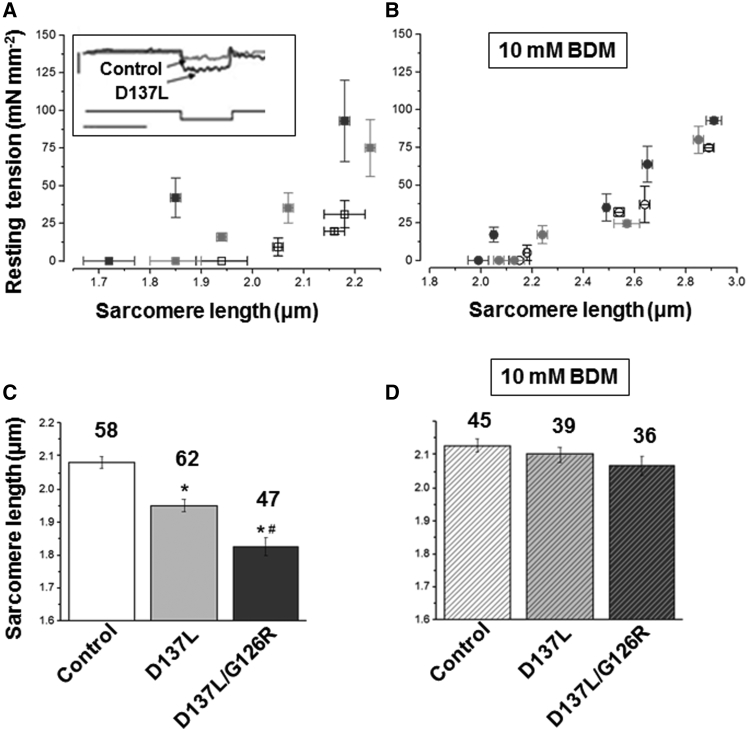
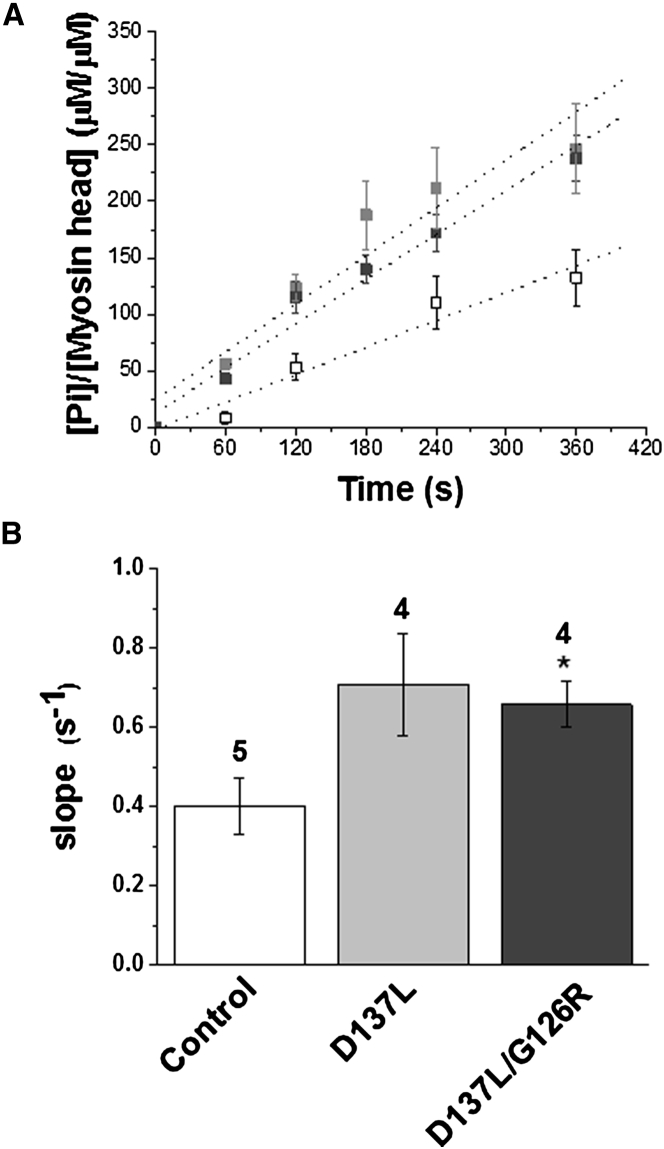
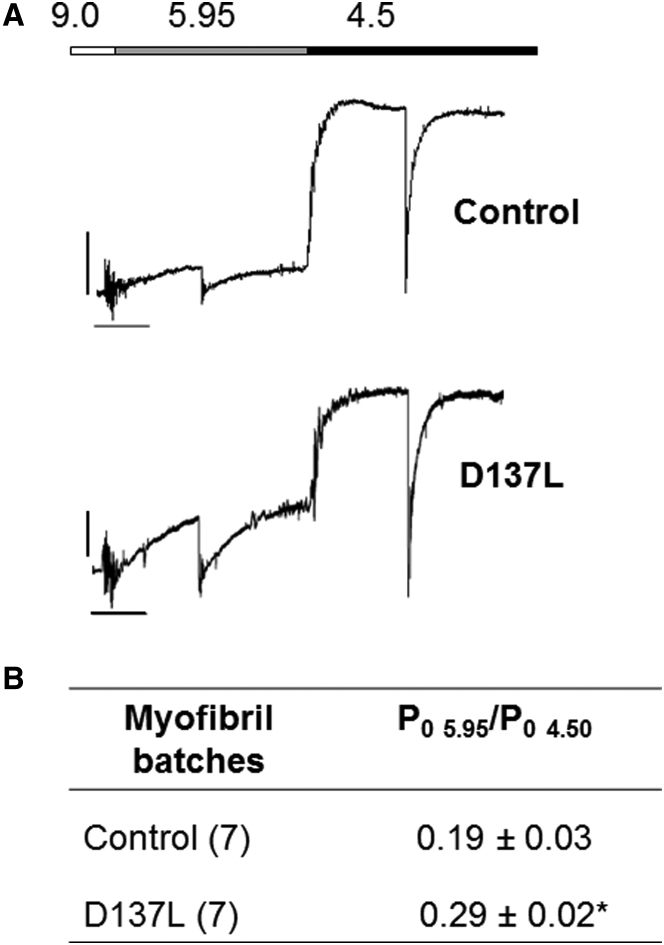
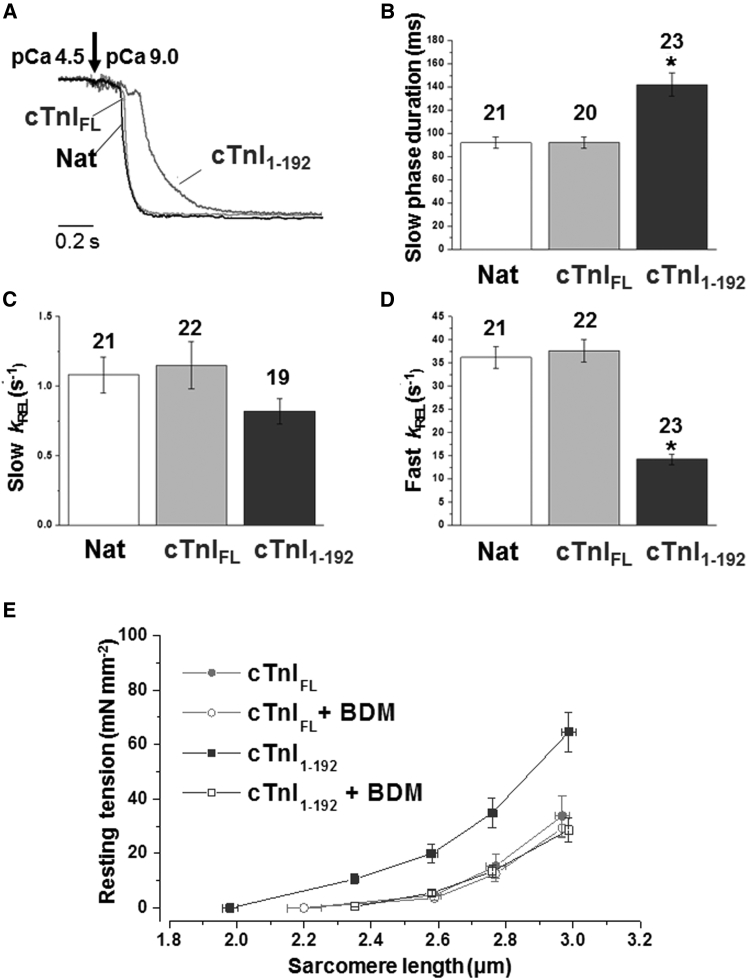
We investigated the functional impact of α-tropomyosin (Tm) substituted with one (D137L) or two (D137L/G126R) stabilizing amino acid substitutions on the mechanical behavior of rabbit psoas skeletal myofibrils by replacing endogenous Tm and troponin (Tn) with recombinant Tm mutants and purified skeletal Tn. Force recordings from myofibrils (15°C) at saturating [Ca2+] showed that Tm-stabilizing substitutions did not significantly affect the maximal isometric tension and the rates of force activation (kACT) and redevelopment (kTR). However, a clear effect was observed on force relaxation: myofibrils with D137L/G126R or D137L Tm showed prolonged durations of the slow phase of relaxation and decreased rates of the fast phase. Both Tm-stabilizing substitutions strongly decreased the slack sarcomere length (SL) at submaximal activating [Ca2+] and increased the steepness of the SL-passive tension relation. These effects were reversed by addition of 10 mM 2,3-butanedione 2-monoxime. Myofibrils also showed an apparent increase in Ca2+ sensitivity. Measurements of myofibrillar ATPase activity in the absence of Ca2+ showed a significant increase in the presence of these Tms, indicating that single and double stabilizing substitutions compromise the full inhibition of contraction in the relaxed state. These data can be understood with the three-state (blocked-closed-open) theory of muscle regulation, according to which the mutations increase the contribution of the active open state in the absence of Ca2+ (M-). Force measurements on myofibrils substituted with C-terminal truncated TnI showed similar compromised relaxation effects, indicating the importance of TnI-Tm interactions in maintaining the blocked state. It appears that reducing the flexibility of native Tm coiled-coil structure decreases the optimum interactions of the central part of Tm with the C-terminal region of TnI. This results in a shift away from the blocked state, allowing myosin binding and activity in the absence of Ca2+. This work provides a basis for understanding the effects of disease-producing mutations in muscle proteins.


Figures

Figure 1
Figure 1
Tm-Tn reconstitution in rabbit skeletal myofibrils. (A) Representative Coomassie blue-stained 12% SDS-PAGE gel image of the extraction and reconstitution of regulatory proteins in rabbit psoas skeletal myofibrils using D137L ααTm. Native, extracted, and D137L ααTm-Tn-reconstituted myofibrils are shown on the right. A skeletal Tn complex and D137L ααTm are shown on the left. (B) Efficiency of extraction-reconstitution with different ααTm molecules in rabbit skeletal myofibrils, averaged from a densitometry analysis of SDS-PAGE gels. Myofibrils were extracted and replaced with Tn and control, D137L, or D173L/G126R ααTm. Tm band intensities are expressed relative to the corresponding actin band. All values are given as mean ± SEM (the number of averaged gels is given above the bars). From the left, Tm/actin density ratios: native, 0.53 ± 0.01; extracted, 0.11 ± 0.01; control, 0.50 ± 0.02; D173L, 0.50 ± 0.03; D173L/G126R, 0.52 ± 0.02.
Figure 2
Figure 2
Maximal isometric active tension generation in rabbit psoas myofibrils containing recombinant control, D137L, or D137L/G126R ααTm at 15°C. (A) Representative recordings (top traces) of force development of control ααTm (left), D137L ααTm (middle), and D137L/G126R ααTm (right) reconstituted skeletal myofibrils maximally activated (pCa 4.5) and fully relaxed (pCa 9.0) by the fast solution switching technique. Bottom traces show where the rapid release (20% l0) and restretch of myofibril length was performed to measure the exponential redevelopment of force (kTR) under steady maximal tension conditions. The rate of tension generation after fast Ca2+ activation (kACT) was measured from the kinetics of force development upon solution switching from a relaxing to an activating solution. Bars above the traces correspond to the timing of the solution change, and numbers correspond to pCa values of activating and relaxing solutions. Tension calibration (vertical bar): 100 mN mm−2; time calibration (horizontal bar): 1 s. Control ααTm: SL 2.50 μm, P0 409 mN mm−2, kACT 6.7 s−1, kTR 6.2 s−1 D137L ααTm: SL 2.31 μm, P0 436 mN mm−2, kACT 6.9 s−1, kTR 6.0 s−1; D137L/G126R ααTm: SL 2.09 μm, P0 mN mm−2, kACT 6.8 s−1, kTR 6.5 s−1. (B) Average values of the kinetics and maximal active and resting tensions of rabbit psoas myofibrils reconstituted with recombinant ααTm species at 15°C. All values are mean ± SEM (pCa 4.5) and each group of data was obtained from different skeletal myofibril batches (numbers in parentheses are the number of myofibrils). p < 0.0001, #p < 0.01 (Student’s t-test) versus the same parameter measured in control ααTm-reconstituted myofibrils.
Figure 3
Figure 3
Relaxation kinetics of rabbit psoas myofibrils containing recombinant control, D137L, or D137L/G126R ααTm at 15°C. (A) Time course of full-force relaxation from maximal activation of representative control and D137L/G126R ααTm-reconstituted myofibrils, obtained by fast solution switching from pCa 4.5 back to a pCa 9.0 relaxing solution. The same traces as in Fig 2A were normalized and presented on an expanded timescale to show the kinetics of force relaxation. Dark gray trace: control ααTm myofibril (duration of slow phase: 129 ms; slow kREL = 1.7 s−1; fast kREL = 13.4 s1). Light gray trace: D137L/G126R ααTm myofibril (duration of slow phase: 91 ms; slow kREL = 1.6 s−1; fast kREL = 38.5 s−1). (B) Mean values of the duration of slow-phase relaxation. (C) Mean values of the rate of the slow phase of relaxation (slow kREL). (D) Mean values of the rate of the fast phase of relaxation (fast kREL). Histogram columns: control (white), D137L (light gray), and D137L/G126R ααTm (dark gray) myofibrils. Bars above the columns are SEM, and the number of myofibrils is shown above the bars. p < 0.0005 (Student’s t-test) versus the same parameter measured in control ααTm-reconstituted myofibrils. #p < 0.05 (Student’s t-test) versus the same parameter measured in control ααTm-reconstituted myofibrils. °p < 0.002 (Student’s t-test) versus the same parameter measured in D137L ααTm-reconstituted myofibrils.
Figure 4
Figure 4
SL and Ca2+-independent tension of control, D137L, and D137L/G126R ααTm-reconstituted myofibrils. (A) Average SL-resting-tension relationships of myofibrils extracted and reconstituted with control (white square), D137L (light gray square), or D137L/G126R (dark gray square) ααTm. Data points at different SLs are means ± SEM (vertical and horizontal bars) of resting-tension values measured in five to nine individual myofibrils. Inset, lower trace: representative trace of 30% l0 step release applied to a myofibril at pCa 9.0; upper traces: Ca2+-independent force response for control ααTm and D137L ααTm mounted myofibrils. Tension calibration (vertical bar): 40 mN mm−2; time calibration (horizontal bar): 50 ms. (B) Effect of 10 mM BDM on average SL-resting-tension relationships for the different groups of Tm-Tn-replaced myofibrils. (C) Mean slack SL of free control, D137L, and D137L/G126R Tm-reconstituted myofibrils measured in relaxing solution. The SLs in the presence of mutant ααTm are significantly shorter compared with control ααTm myofibrils (p < 0.0001). SLs are also considerably shorter in D137L/G126R ααTm myofibrils than in D137L ααTm myofibrils (# p < 0.01). (D) Effect of 10 mM BDM on the mean slack SLs of control, D137L, and D137L/G126R ααTm-reconstituted myofibrils. All values (μm) are given as mean ± SEM: control ααTm 2.08 ± 0.02, control + BDM 2.13 ± 0.02; D137L ααTm 1.95 ± 0.02, D137L + BDM 2.10 ± 0.02; D137L/G126R ααTm 1.83 ± 0.03, D137L/G126R + BDM 2.07 ± 0.03. The number of myofibrils is given above the bars.
Figure 5
Figure 5
Myofibrillar ATPase at low [Ca2+] is much greater for reconstituted myofibrils containing D137L (light gray square) and D137L/G126R (dark gray square) compared with control ααTm (white square) (30°C). (A) ATPase activity of reconstituted myofibrils measured in relaxing solution (pCa 9.0). Each point is the mean ± SEM of four measurements (five for control ααTm). The steady-state ATPase rate was obtained from regression lines (dotted lines) fitted on all individual data points. (B) Average slope of regression lines (steady-state rate; s−1) of replaced myofibrils: control ααTm 0.40 ± 0.07; D137L ααTm 0.71 ± 0.13; D137L/G126R ααTm 0.66 ± 0.06. The steady-state rate was significantly increased in D137L/G126R ααTm compared with control ααTm myofibrils (p < 0.05, Student’s t-test).
Figure 6
Figure 6
D137L ααTm-reconstituted myofibrils show a greater active tension than control at submaximal Ca2+ activation. (A) Myofibrils replaced with control ααTm (upper trace) and D137L ααTm (lower trace) were activated at pCa 5.95 and then subjected to [Ca2+] jumps to pCa 4.50 at 15°C. At each level of Ca2+ activation, a release-restretch was applied to the preparation under steady-state conditions of tension generation. Bars above the traces correspond to the timing of the solution change, and numbers correspond to the pCa values of relaxing, submaximal, and maximal activating solutions. Tension calibration (vertical bar): 100 mN mm−2; time calibration (horizontal bar): 1 s. Control ααTm myofibril: SL 2.31 μm, resting tension 20 mN mm–2, Po 5.95/Po 4.50 = 0.17; D137L ααTm myofibril: SL 2.18 μm, resting tension 90 mN mm–2, Po 5.95/Po 4.50 = 0.36. (B) Mean values for the ratio of submaximal pCa 5.95 to maximal pCa 4.5 activated tension obtained from [Ca2+] jump experiments in control and D137L ααTm-replaced myofibrils. Values are given as means ± SEM; numbers in parentheses are the number of myofibrils; p < 0.02, Student’s t-test.
Figure 7
Figure 7
Relaxation kinetics and SL-resting-tension relationship of rabbit psoas myofibrils after exchange of endogenous TnI with a C-terminal truncated TnI form (cTnI1-192) at 15°C. (A) Time course of full-force relaxation from maximal activation of native (unexchanged) myofibrils (Nat, black line) and myofibrils in which whole native Tn had been replaced (by exchange) by cTn, including either the full-length (cTnIFL, gray line) or truncated (1–192 (cTnI1-192), dark gray line) cTnI subunit, normalized and presented on an expanded timescale to show the kinetics of force relaxation. (B) Mean values of the duration of slow-phase relaxation. (C) Mean values of the rate of the slow phase of relaxation (slow kREL). (D) Mean values of the rate of the fast phase of relaxation (fast kREL). p < 0.01 versus the same parameter measured in cTnIFL and native unexchanged myofibrils. The number of myofibrils is given above the bars. (E) Average SL-resting-tension relationships of myofibrils replaced with either cTnIFL (gray solid circle) or cTnI1-192 (dark gray square). BDM (10 mM) completely abolishes the difference in passive tension (open square, cTnI1-192; open circle, cTnIFL). Vertical and horizontal bars are SEM. Resting tension and mean SL were measured under quasi-steady-state conditions.

References

    1. Gordon A.M., Homsher E., Regnier M. Regulation of contraction in striated muscle. Physiol. Rev. 2000;80:853–924. - PubMed
    1. Galińska-Rakoczy A., Engel P., Lehman W. Structural basis for the regulation of muscle contraction by troponin and tropomyosin. J. Mol. Biol. 2008;379:929–935. - PMC - PubMed
    1. Lehman W. Thin filament structure and the steric blocking model. Compr. Physiol. 2016;6:1043–1069. - PubMed
    1. Geeves M.A. Thin filament regulation. Compr. Biophys. 2012;4:251–267.
    1. Moore J.R., Campbell S.G., Lehman W. Structural determinants of muscle thin filament cooperativity. Arch. Biochem. Biophys. 2016;594:8–17. - PMC - PubMed

LinkOut - more resources