

Arginine Deprivation Inhibits the Warburg Effect and Upregulates Glutamine Anaplerosis and Serine Biosynthesis in ASS1-Deficient Cancers
- PMID: 28122247
- PMCID: PMC5840045
- DOI: 10.1016/j.celrep.2016.12.077
Arginine Deprivation Inhibits the Warburg Effect and Upregulates Glutamine Anaplerosis and Serine Biosynthesis in ASS1-Deficient Cancers
Abstract
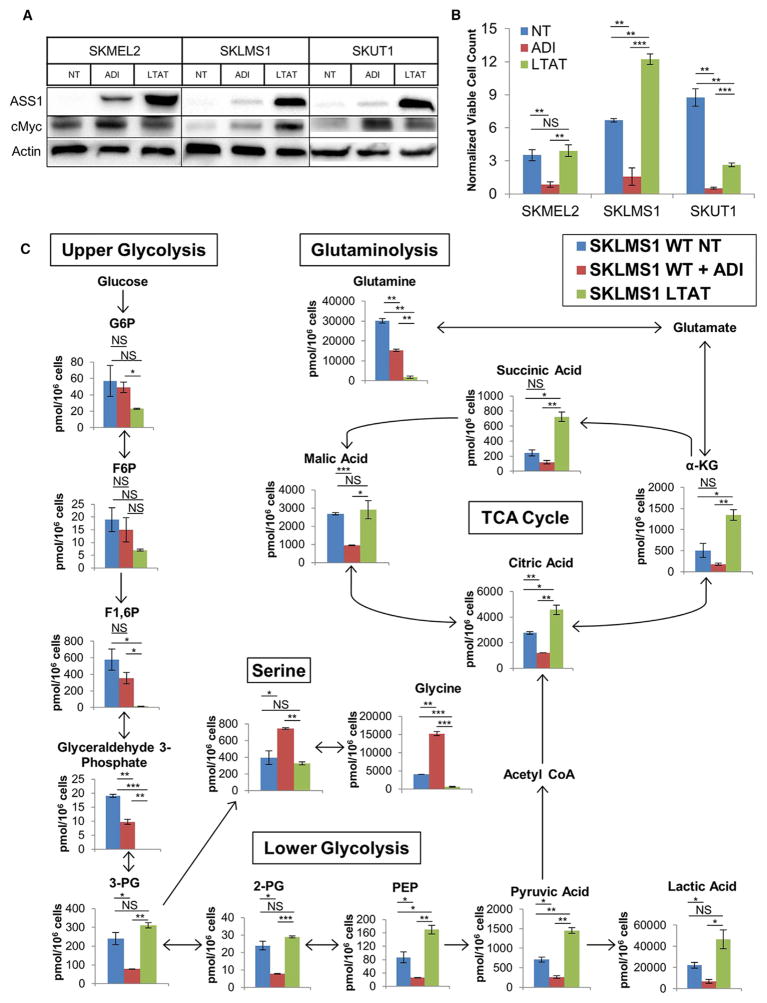
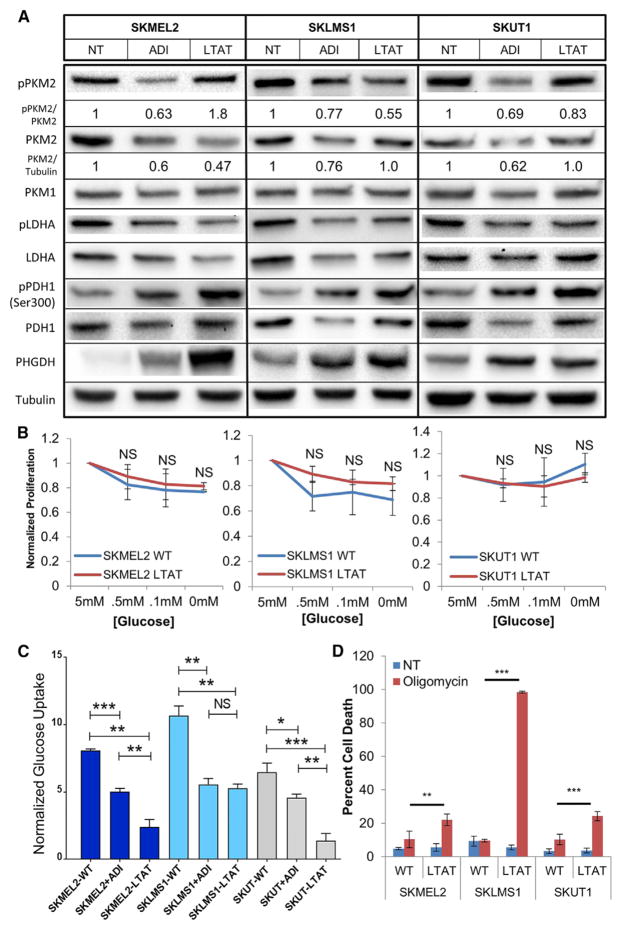
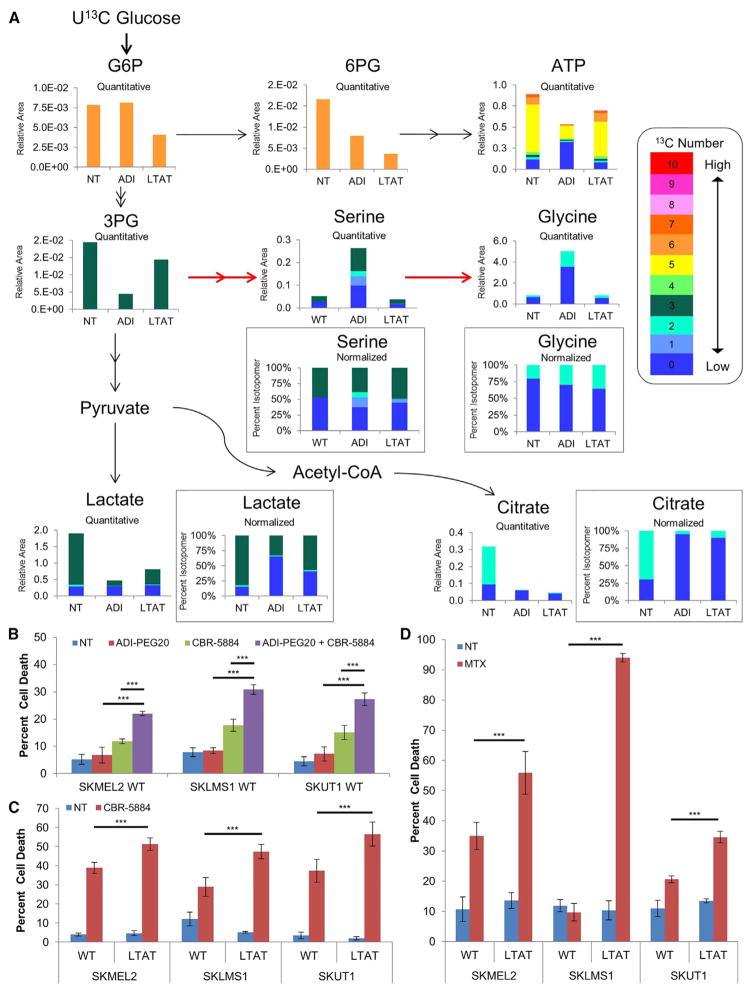
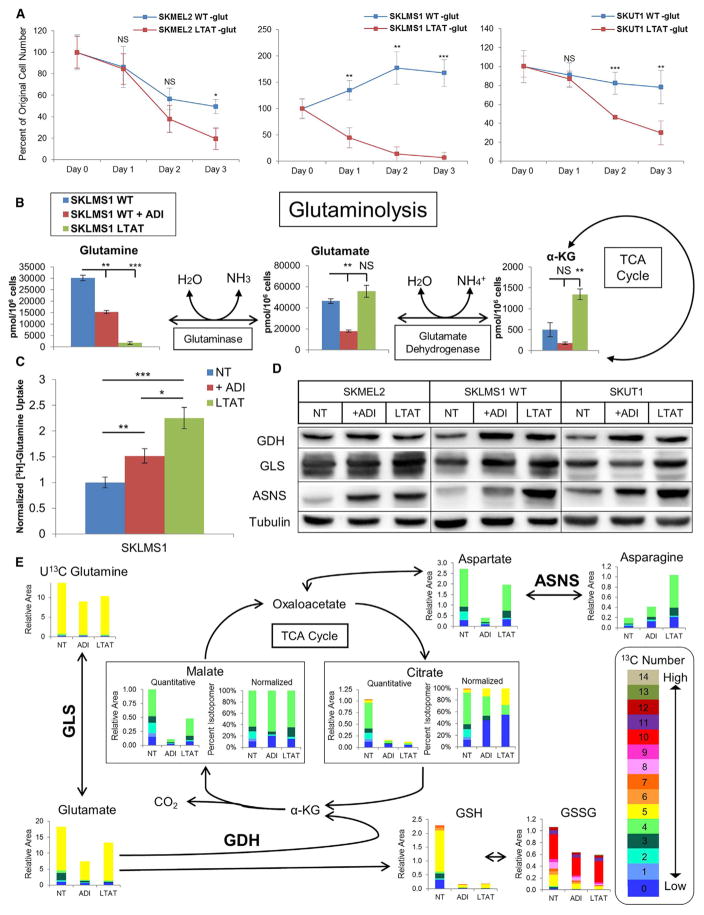
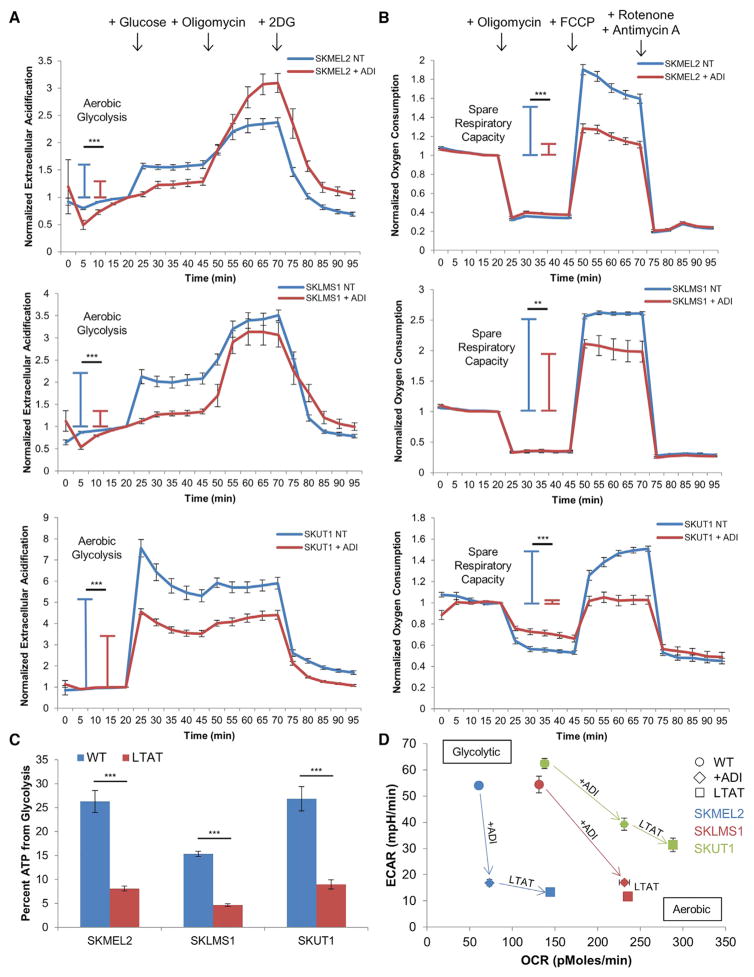
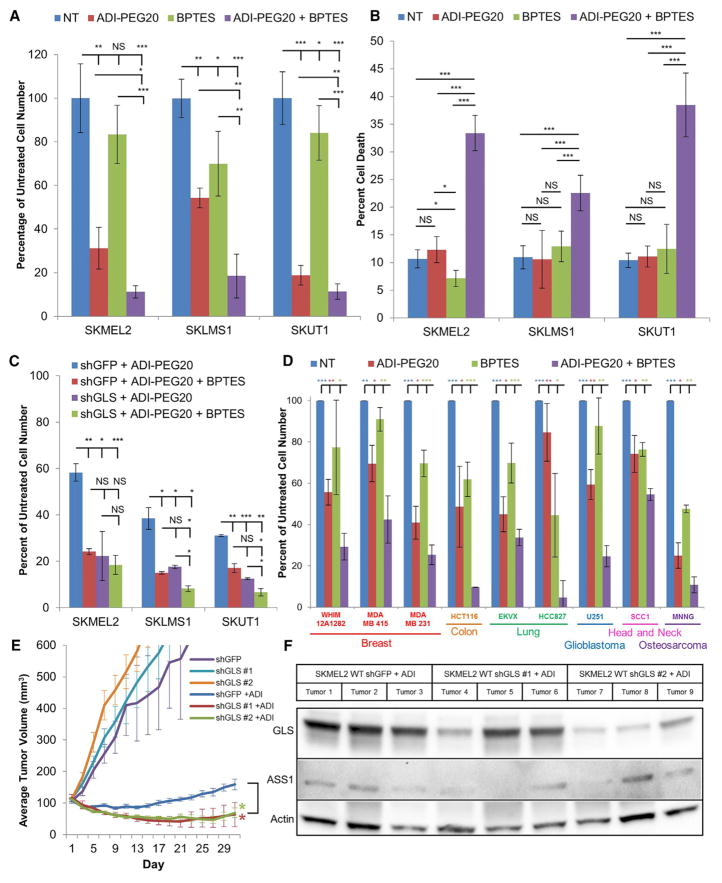
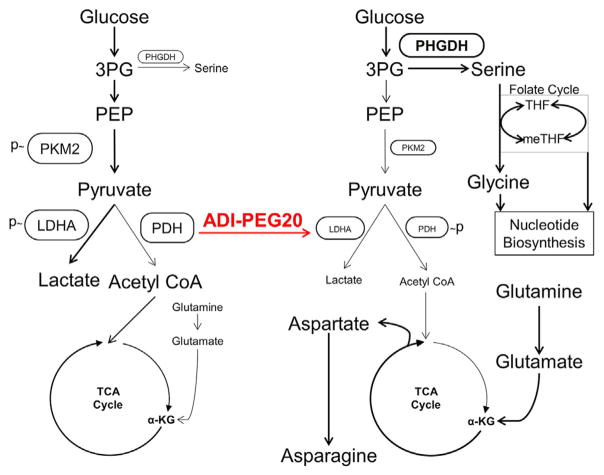
Targeting defects in metabolism is an underutilized strategy for the treatment of cancer. Arginine auxotrophy resulting from the silencing of argininosuccinate synthetase 1 (ASS1) is a common metabolic alteration reported in a broad range of aggressive cancers. To assess the metabolic effects that arise from acute and chronic arginine starvation in ASS1-deficient cell lines, we performed metabolite profiling. We found that pharmacologically induced arginine depletion causes increased serine biosynthesis, glutamine anaplerosis, oxidative phosphorylation, and decreased aerobic glycolysis, effectively inhibiting the Warburg effect. The reduction of glycolysis in cells otherwise dependent on aerobic glycolysis is correlated with reduced PKM2 expression and phosphorylation and upregulation of PHGDH. Concurrent arginine deprivation and glutaminase inhibition was found to be synthetic lethal across a spectrum of ASS1-deficient tumor cell lines and is sufficient to cause in vivo tumor regression in mice. These results identify two synthetic lethal therapeutic strategies exploiting metabolic vulnerabilities of ASS1-negative cancers.
Keywords: Warburg effect; arginine; arginine deprivation; argininosuccinate synthetase 1; cancer metabolism; glutamine; glutamine anaplerosis; sarcoma; serine; serine biosynthesis.
Copyright © 2017 The Author(s). Published by Elsevier Inc. All rights reserved.
Figures
Similar articles
-
Arginine deiminase resistance in melanoma cells is associated with metabolic reprogramming, glucose dependence, and glutamine addiction.Mol Cancer Ther. 2013 Nov;12(11):2581-90. doi: 10.1158/1535-7163.MCT-13-0302. Epub 2013 Aug 26. Mol Cancer Ther. 2013. PMID: 23979920 Free PMC article.
-
Histone deacetylase inhibition is synthetically lethal with arginine deprivation in pancreatic cancers with low argininosuccinate synthetase 1 expression.Theranostics. 2020 Jan 1;10(2):829-840. doi: 10.7150/thno.40195. eCollection 2020. Theranostics. 2020. PMID: 31903153 Free PMC article.
-
Therapeutic arginine starvation in ASS1-deficient cancers inhibits the Warburg effect.Mol Cell Oncol. 2017 Mar 1;4(3):e1295131. doi: 10.1080/23723556.2017.1295131. eCollection 2017. Mol Cell Oncol. 2017. PMID: 28616574 Free PMC article.
-
Bench-to-Bedside Studies of Arginine Deprivation in Cancer.Molecules. 2023 Feb 24;28(5):2150. doi: 10.3390/molecules28052150. Molecules. 2023. PMID: 36903394 Free PMC article. Review.
-
Arginine deprivation and argininosuccinate synthetase expression in the treatment of cancer.Int J Cancer. 2010 Jun 15;126(12):2762-72. doi: 10.1002/ijc.25202. Int J Cancer. 2010. PMID: 20104527 Review.
Cited by
-
Role of mitochondria in rescuing glycolytically inhibited subpopulation of triple negative but not hormone-responsive breast cancer cells.Sci Rep. 2019 Sep 24;9(1):13748. doi: 10.1038/s41598-019-50141-z. Sci Rep. 2019. PMID: 31551501 Free PMC article.
-
2-Deoxy-d-Glucose-Induced Metabolic Alteration in Human Oral Squamous SCC15 Cells: Involvement of N-Glycosylation of Axl and Met.Metabolites. 2019 Sep 17;9(9):188. doi: 10.3390/metabo9090188. Metabolites. 2019. PMID: 31533338 Free PMC article.
-
Unlocking the Potential of Arginine Deprivation Therapy: Recent Breakthroughs and Promising Future for Cancer Treatment.Int J Mol Sci. 2023 Jun 26;24(13):10668. doi: 10.3390/ijms241310668. Int J Mol Sci. 2023. PMID: 37445845 Free PMC article. Review.
-
We're Not "DON" Yet: Optimal Dosing and Prodrug Delivery of 6-Diazo-5-oxo-L-norleucine.Mol Cancer Ther. 2018 Sep;17(9):1824-1832. doi: 10.1158/1535-7163.MCT-17-1148. Mol Cancer Ther. 2018. PMID: 30181331 Free PMC article. Review.
-
Exploring the Role of Metabolites in Cancer and the Associated Nerve Crosstalk.Nutrients. 2022 Apr 21;14(9):1722. doi: 10.3390/nu14091722. Nutrients. 2022. PMID: 35565690 Free PMC article. Review.
References
-
- Allen MD, Luong P, Hudson C, Leyton J, Delage B, Ghazaly E, Cutts R, Yuan M, Syed N, Lo Nigro C, et al. Prognostic and therapeutic impact of argininosuccinate synthetase 1 control in bladder cancer as monitored longitudinally by PET imaging. Cancer Res. 2014;74:896–907. - PubMed
-
- Chaneton B, Gottlieb E. Rocking cell metabolism: revised functions of the key glycolytic regulator PKM2 in cancer. Trends Biochem Sci. 2012;37:309–316. - PubMed
MeSH terms
Substances
Grants and funding
LinkOut - more resources
Full Text Sources
Other Literature Sources
Miscellaneous
