. 2017 Jan 26;14(1):2.
doi: 10.1186/s12976-017-0048-7.

Thermodynamic considerations in renal separation processes

Affiliations

Thermodynamic considerations in renal separation processes

Robert H Louw et al. Theor Biol Med Model. .

Abstract

Background: Urine production in the kidney is generally thought to be an energy-intensive process requiring large amounts of metabolic activity to power active transport mechanisms. This study uses a thermodynamic analysis to evaluate the minimum work requirements for urine production in the human kidney and provide a new perspective on the energy costs of urine production. In this study, black-box models are used to compare the Gibbs energy inflow and outflow of the overall kidney and physiologically-based subsections in the kidney, to calculate the work of separation for urine production.

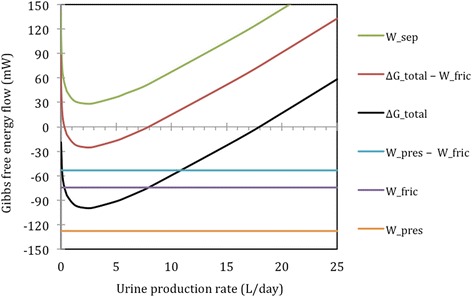
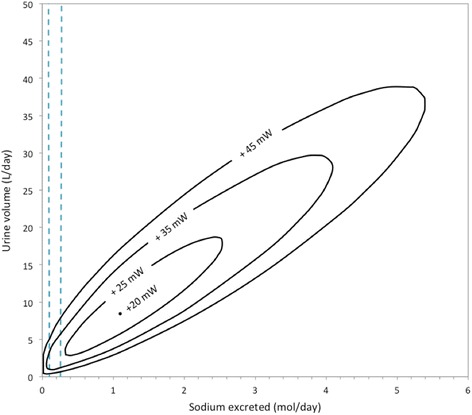
Results: The results describe the work done during urine production broadly and for specific scenarios. Firstly, it shows glomerular filtration in both kidneys requires work to be done at a rate of 5 mW under typical conditions in the kidney. Thereafter, less than 54 mW is sufficient to concentrate the filtrate into urine, even in the extreme cases considered. We have also related separation work in the kidney with the excretion rates of individual substances, including sodium, potassium, urea and water. Lastly, the thermodynamic calculations indicate that plasma dilution significantly reduces the energy cost of separating urine from blood.

Conclusions: A comparison of these thermodynamic results with physiological reference points, elucidates how various factors affect the energy cost of the process. Surprisingly little energy is required to produce human urine, seeing that double the amount of work can theoretically be done with all the energy provided through pressure drop of blood flow through the kidneys, while the metabolic energy consumption of the kidneys could possibly drive almost one hundred times more separation work. Nonetheless, the model's outputs, which are summarised graphically, show the separation work's nuances, which can be further analysed in the context of more empirical evidence.

Keywords: Energy balance; Gibbs energy; Human kidney; Sensitivity analysis; Separation work; Urine production.


Figures

Fig. 1
Fig. 1
The black-box models of the kidney used in this study, showing the overall black-box model (solid borderline), which is then divided into two mass-transfer processes (dashed borderlines): filtration in the glomeruli and reabsorption in the tubular system. The valve symbol (▻◅) indicates positions where there is a pressure drop due to friction in the kidney
Fig. 2
Fig. 2
The Gibbs energy flow in or out of the process streams for different urine volume production rates, at a constant solute excretion of 731 mmol/day, as in Table 2. Variables depicted on the graph include total change in Gibbs energy (ΔGtotal), pressure work (Wpres), separation work (Wsep) and friction losses (Wfric); these variables are described in Eqs. 2, 3, 4 and 5 respectively. Negative values for ΔGtotal indicate that there is excess or lost work, which implies the stream parameters are achievable without additional work applied to the system
Fig. 3
Fig. 3
The Gibbs energy flow in or out of the process streams during glomerular filtration for different urine volume production rates, at a constant solute excretion of 731 mmol/day, as in Table 2. The blue line is the separation work across the glomeruli; the orange line is the pressure work and the black line is the sum of these two. Negative values for G indicate excess potential to do work
Fig. 4
Fig. 4
The Gibbs energy flow in or out of the process streams during tubular reabsorption and its components for different urine volume production rates, at a constant solute excretion of 731 mmol/day, as in Table 2. As in the previous graph, the blue curve corresponds to separation work, the orange line to pressure work and the black curve to the total. Negative values for G indicate excess potential to do work
Fig. 5
Fig. 5
A Gibbs energy contour map, depicting the variation of separation work (Wsep) in the overall kidney, as sodium chloride and water excretion is varied, with the dashed lines indicating the typical reference range of excretion rates in humans. The concentrations of all other solutes and the reference range concentration are as in Table 2
Fig. 6
Fig. 6
A Gibbs energy contour map, depicting the effect of varying the amount of water and urea excreted on separation work (Wsep) in the overall kidney, with the dashed lines indicating the typical reference range of excretion rates in humans. The concentrations of all other solutes and the reference range concentration are as in Table 2
Fig. 7
Fig. 7
A Gibbs energy contour map, depicting the effect of varying the amount of water and potassium chloride excreted on separation work (Wsep) in the overall system, with the dashed lines indicating the typical reference range of excretion rates in humans. The concentrations of all other solutes and the reference range concentration are as in Table 2
Fig. 8
Fig. 8
The required amount of separation work (Wsep) required in the overall kidneys to produce a volume of urine, relative of plasma solute concentrations for the blood entering the kidneys
Fig. 9
Fig. 9
The separation work requirement (Wsep) for different urine production volumes in the human kidneys, when a person’s blood plasma volume is varied while the amount of blood solutes is kept constant. In this graph, a person who would otherwise contain 3 litres of blood plasma and 291 mmol/l of solutes, as in Table 1, has his blood diluted or concentrated through the addition or removal of water. In other words, this graph effectively depicts changes in the blood plasma concentration fed into the system versus the work requirement associated with urine production volumes

References

    1. Borsook H, Winegarden HM. The Work of the Kidney in the Production of Urine., 17(1), 3. Proc Natl Acad Sci U S A. 1931;17(1):3–12. doi: 10.1073/pnas.17.1.3. - DOI - PMC - PubMed
    1. Burtis CA, Ashwood ER, Bruns DE. Tiez Textbook of Clinical Chemistry and Molecular Diagnostics. St. Louis: Elsevier Health Sciences; 2012.
    1. Cameron IL, Kanal KM, Fullerton GD. Role of protein conformation and aggregation in pumping water in and out of a cell. Cell Biol Int. 2006;30(1):78–85. doi: 10.1016/j.cellbi.2005.09.010. - DOI - PubMed
    1. Casellas D, Navar LG. In vitro perfusion of juxtamedullary nephrons in rats. Am J Physiol. 1984;246(3):F349–F358. - PubMed
    1. Clausen C, Layton AT, Moore LC, Nieves-González A. Transport efficiency and workload distribution in a mathematical model of the thick ascending limb. Am J Physiol Ren Physiol. 2013;304(6):F653–F664. doi: 10.1152/ajprenal.00101.2012. - DOI - PMC - PubMed

Publication types

LinkOut - more resources