Clinical Trial
. 2017 Jan 23;5(1):10.
doi: 10.1186/s40168-016-0225-7.

Microbiota Transfer Therapy alters gut ecosystem and improves gastrointestinal and autism symptoms: an open-label study

Affiliations
Clinical Trial

Microbiota Transfer Therapy alters gut ecosystem and improves gastrointestinal and autism symptoms: an open-label study

Dae-Wook Kang et al. Microbiome. .

Abstract

Background: Autism spectrum disorders (ASD) are complex neurobiological disorders that impair social interactions and communication and lead to restricted, repetitive, and stereotyped patterns of behavior, interests, and activities. The causes of these disorders remain poorly understood, but gut microbiota, the 1013 bacteria in the human intestines, have been implicated because children with ASD often suffer gastrointestinal (GI) problems that correlate with ASD severity. Several previous studies have reported abnormal gut bacteria in children with ASD. The gut microbiome-ASD connection has been tested in a mouse model of ASD, where the microbiome was mechanistically linked to abnormal metabolites and behavior. Similarly, a study of children with ASD found that oral non-absorbable antibiotic treatment improved GI and ASD symptoms, albeit temporarily. Here, a small open-label clinical trial evaluated the impact of Microbiota Transfer Therapy (MTT) on gut microbiota composition and GI and ASD symptoms of 18 ASD-diagnosed children.

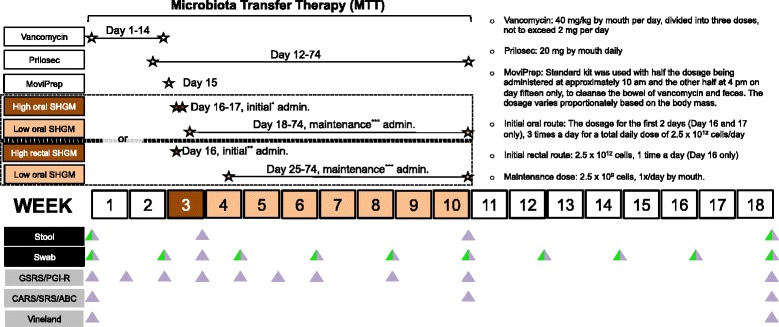
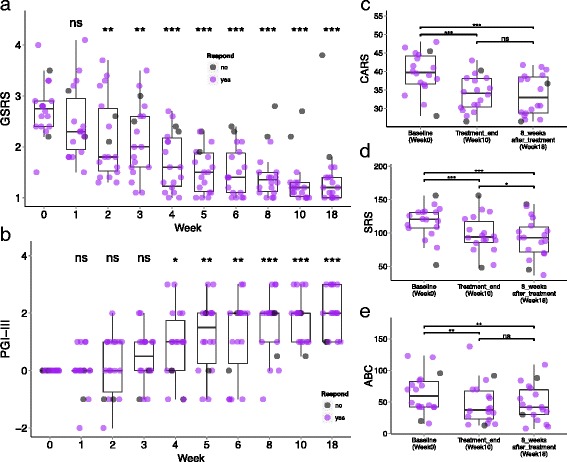
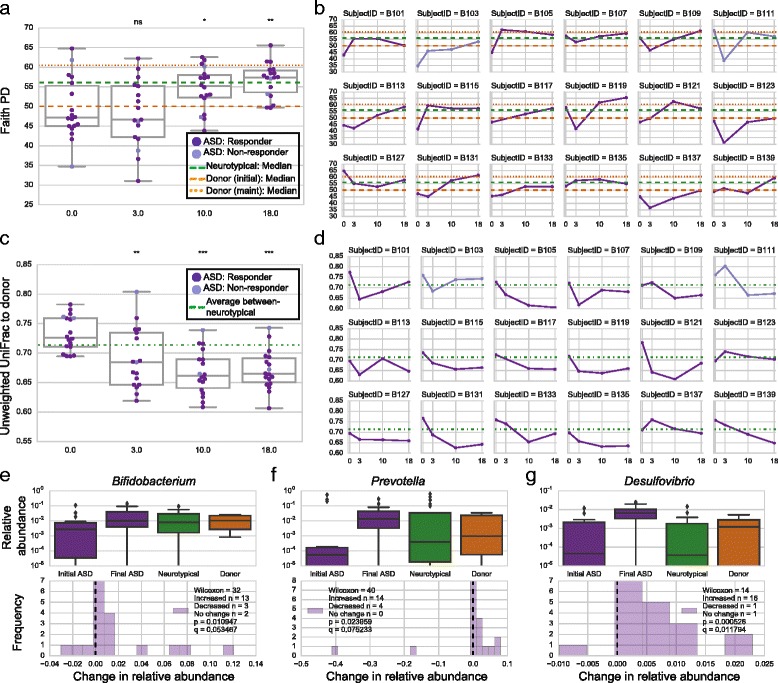
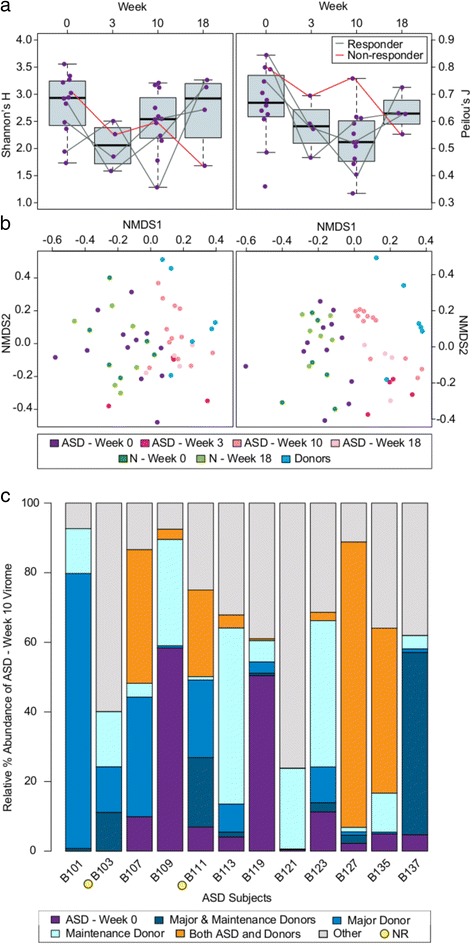
Results: MTT involved a 2-week antibiotic treatment, a bowel cleanse, and then an extended fecal microbiota transplant (FMT) using a high initial dose followed by daily and lower maintenance doses for 7-8 weeks. The Gastrointestinal Symptom Rating Scale revealed an approximately 80% reduction of GI symptoms at the end of treatment, including significant improvements in symptoms of constipation, diarrhea, indigestion, and abdominal pain. Improvements persisted 8 weeks after treatment. Similarly, clinical assessments showed that behavioral ASD symptoms improved significantly and remained improved 8 weeks after treatment ended. Bacterial and phagedeep sequencing analyses revealed successful partial engraftment of donor microbiota and beneficial changes in the gut environment. Specifically, overall bacterial diversity and the abundance of Bifidobacterium, Prevotella, and Desulfovibrio among other taxa increased following MTT, and these changes persisted after treatment stopped (followed for 8 weeks).

Conclusions: This exploratory, extended-duration treatment protocol thus appears to be a promising approach to alter the gut microbiome and virome and improve GI and behavioral symptoms of ASD. Improvements in GI symptoms, ASD symptoms, and the microbiome all persisted for at least 8 weeks after treatment ended, suggesting a long-term impact.

Trial registration: This trial was registered on the ClinicalTrials.gov, with the registration number NCT02504554.

Keywords: Autism spectrum disorders (ASD); Clinical trial; Fecal microbiota transplant (FMT); Gut bacteria; Gut bacteriophage; Microbiome; Virome.


Figures

Fig. 1
Fig. 1
Study design timeline. The trial consists of 10-week Microbiota Transfer Therapy (MTT) and 8-week follow-up observation period after treatment stopped. Schematic timeline represents a series of treatments that were performed during MTT (top) and frequencies of sample collection and GI/behavior assessments (bottom; neurotypical and ASD group colored in green and purple, respectively)
Fig. 2
Fig. 2
GI- and ASD-related symptoms of 18 children with ASD. Children were treated with MTT for 10 weeks, with a single follow-up evaluation 8 weeks after treatment ended. a GSRS scores vs. time. GSRS is scored on a Likert scale from 1 (no symptoms) to 7 (very severe discomfort). b Changes in PGI-III scores (overall autism/related symptoms). PGI-III is scored from −3 (much worse), −2 (worse), −1 (slightly worse), 0 (no change), 1 (slightly better), 2 (better) to 3 (much better) compared to baseline. c CARS assessment at pre-treatment, post-treatment, and 8 weeks post-treatment. d Total SRS score at pre-treatment, post-treatment, and 8 weeks post-treatment. e Total ABC score at pre-treatment, post-treatment, and 8 weeks post-treatment. The data points represent 18 individual participants, and some data points overlap in the box plot. Asterisks (at the top of the box plot) indicate whether individuals (at each time points) have significantly decreased since pre-treatment (week 0). ns indicates not significant, single asterisk indicates p < 0.05, double asterisks indicate p < 0.01, triple asterisks indicate p < 0.001 (two-tailed Wilcoxon signed-rank test). Two participants who had less than 50% improvement in GSRS scores are defined as non-responders and color-coded in grey
Fig. 3
Fig. 3
Stool microbiota changes with fecal microbiota transplant. a Changes in Faith’s phylogenetic diversity (PD) in the microbiota of 18 children with ASD as measured from stool samples. Orange lines indicate median PD of the donor samples (dashed line represents initial donor samples (n = 5), and dotted line represents maintenance dose samples (n = 2)), and green line indicates median PD of 20 neurotypical controls at week 0. ns indicates not significant, single asterisk indicates q < 0.05, double asterisks indicate q < 0.01, triple asterisks indicate q < 0.001 (two-tailed Wilcoxon signed-rank test comparing weeks 3, 10, and 18 to week 0 values). b Change in Faith’s PD tracked on a per individual basis for all MTT recipients. Most individuals experienced an increase in gut microbiota PD. c Unweighted UniFrac distances between ASD gut microbiota and most relevant donor sample (initial donor sample at weeks 0 and 3, most recent maintenance dose sample at weeks 10 and 18). Green line indicates the median interpersonal variation between neurotypical controls and illustrates that prior to treatment the difference in gut microbiota composition between MTT recipients and donors was on the order of normal interpersonal variation. Following treatment, the MTT recipients were more similar to donors than normal interpersonal variation. Statistics are the same as those used in a. d Distances between ASD gut microbiota and donor sample on a per individual basis. Most individuals became more similar to the donor over the study period. e–g Box plots illustrating relative abundances of three genera, Bifidobacterium, Prevotella, and Desulfovibrio, in the gut microbiota by group (top; log scale), and changes in relative abundances at week 18 in the ASD group (bottom). All p values were corrected using the Benjamini-Hochberg false discovery rate correction to create q values. Analogous plots based on different diversity metrics are presented as supplementary figures
Fig. 4
Fig. 4
Stool virome change with fecal microbiota transplant. a Diversity indices, Shannon’s H′ (a measure of biodiversity and richness; left) and Peilou’s J (a measure of evenness; right), of the ASD participants. Fecal samples were collected at all four time points for 4 out of the 12 ASD subjects where the bacteriophage communities were assessed. The responders (indicated by a grey line) rebounded in biodiversity, richness, and evenness following MTT. In contrast, the non-responder (indicated by a red line) did not recover. b Nonmetric multidimensional scaling of Bray-Curtis dissimilarity (right; 2D stress = 0.2467) and Jaccard (left; 2D stress = 0.2212) distances reveal that ASD gut bacteriophage communities are more similar to donor gut bacteriophage communities following both the high and lower SHGM doses. c Analyses of ASD virome composition at week 10 shows engraftment of donor bacteriophage populations across all ASD subjects. In > 80% of the subjects, the starting (week 0) bacteriophage populations make up < 20% of the virome at week 10. NR stands for non-responder

References

    1. World Health Organization. International statistical classification of diseases and health related problems, Tenth Revision (ICD-10). Geneva: World Health Organization; 2004.
    1. Lai MC, Lombardo MV, Baron-Cohen S. Autism. Lancet. 2014;383(9920):896–910. doi: 10.1016/S0140-6736(13)61539-1. - DOI - PubMed
    1. Dominguez-Bello MG, Costello EK, Contreras M, Magris M, Hidalgo G, Fierer N, Knight R. Delivery mode shapes the acquisition and structure of the initial microbiota across multiple body habitats in newborns. Proc Natl Acad Sci U S A. 2010;107(26):11971–11975. doi: 10.1073/pnas.1002601107. - DOI - PMC - PubMed
    1. Neul JL, Sahin M. Therapeutic advances in autism and other neurodevelopmental disorders. Neurotherapeutics. 2015;12(3):519–520. doi: 10.1007/s13311-015-0364-8. - DOI - PMC - PubMed
    1. McElhanon BO, McCracken C, Karpen S, Sharp WG. Gastrointestinal symptoms in autism spectrum disorder: a meta-analysis. Pediatrics. 2014;133(5):872–883. doi: 10.1542/peds.2013-3995. - DOI - PubMed

Publication types

MeSH terms

Associated data