. 2017 Apr 1;312(4):F791-F805.
doi: 10.1152/ajprenal.00465.2015. Epub 2017 Jan 25.

Primary cilia regulate the osmotic stress response of renal epithelial cells through TRPM3

Affiliations

Primary cilia regulate the osmotic stress response of renal epithelial cells through TRPM3

Brian J Siroky et al. Am J Physiol Renal Physiol. .

Abstract

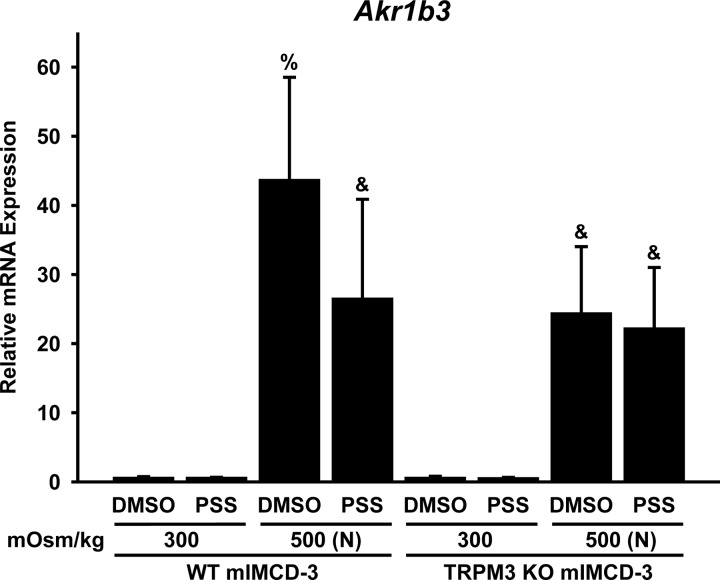
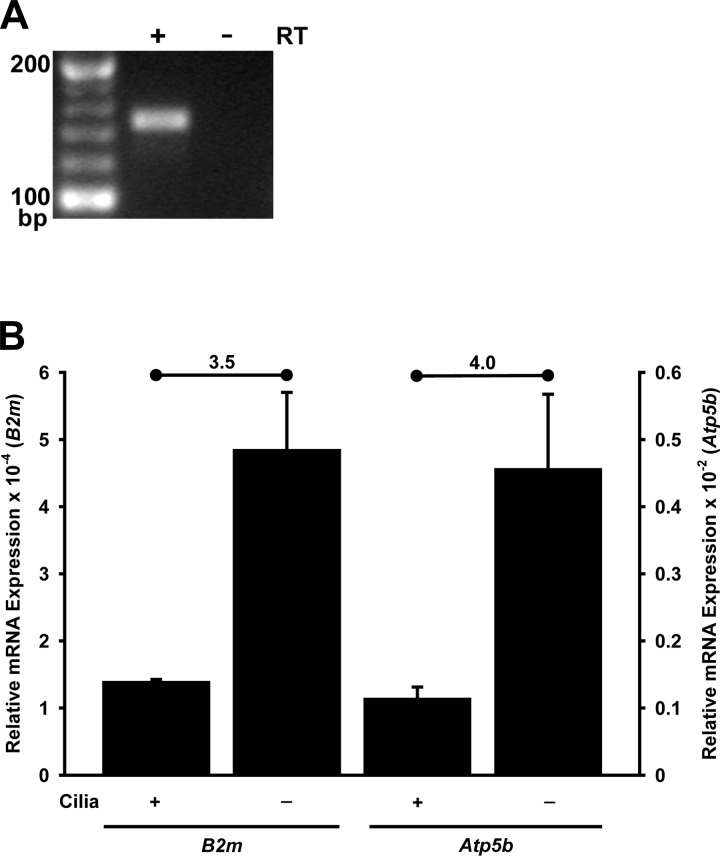
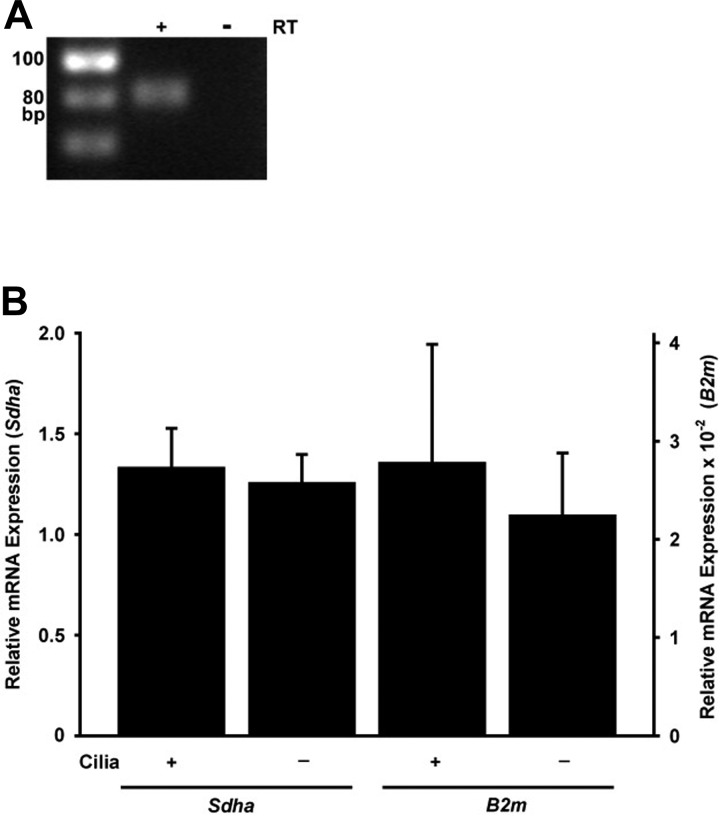
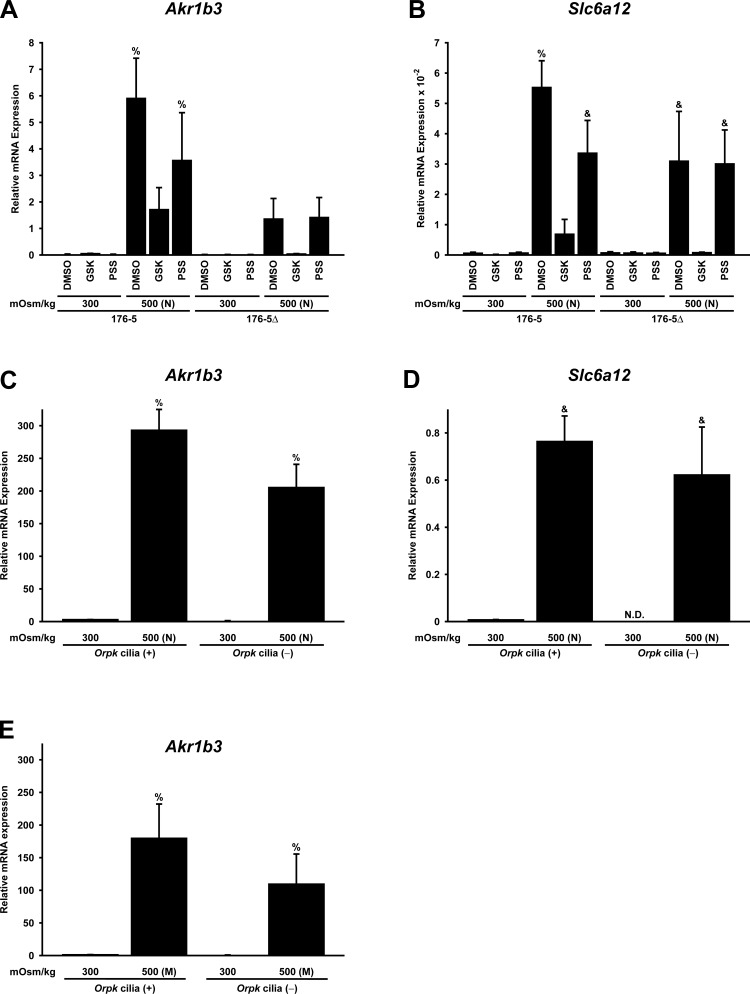
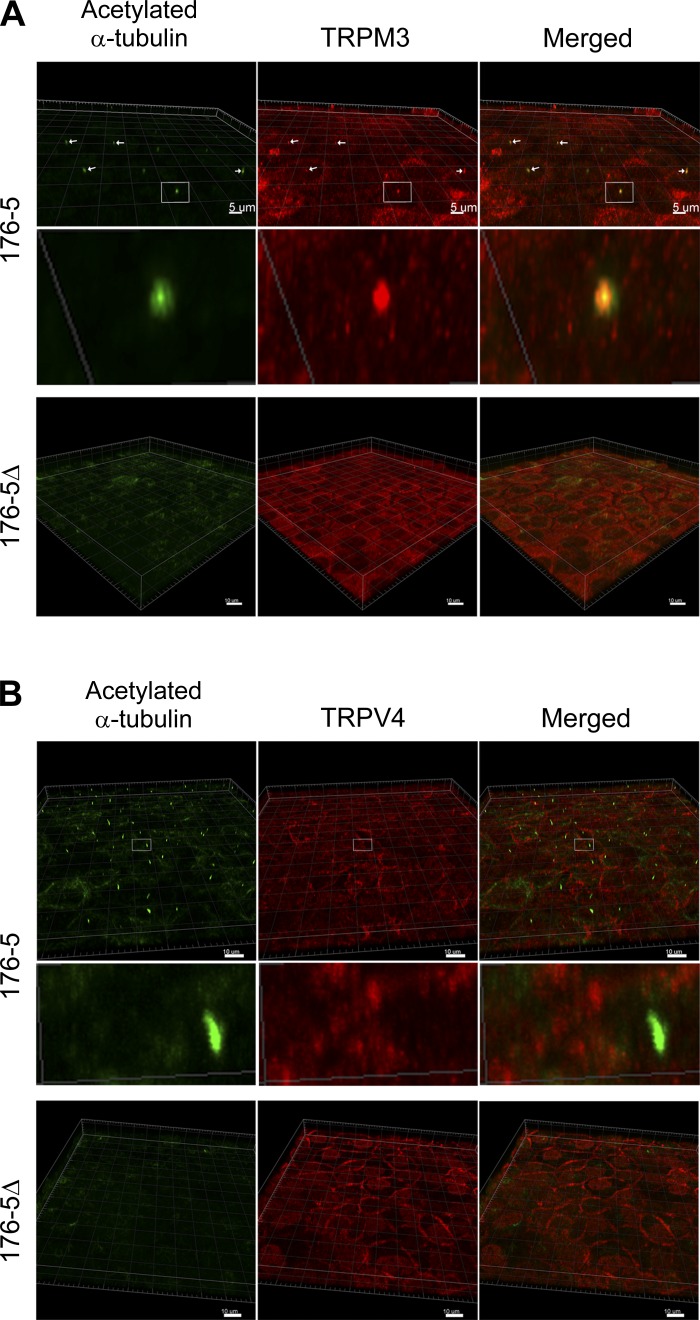
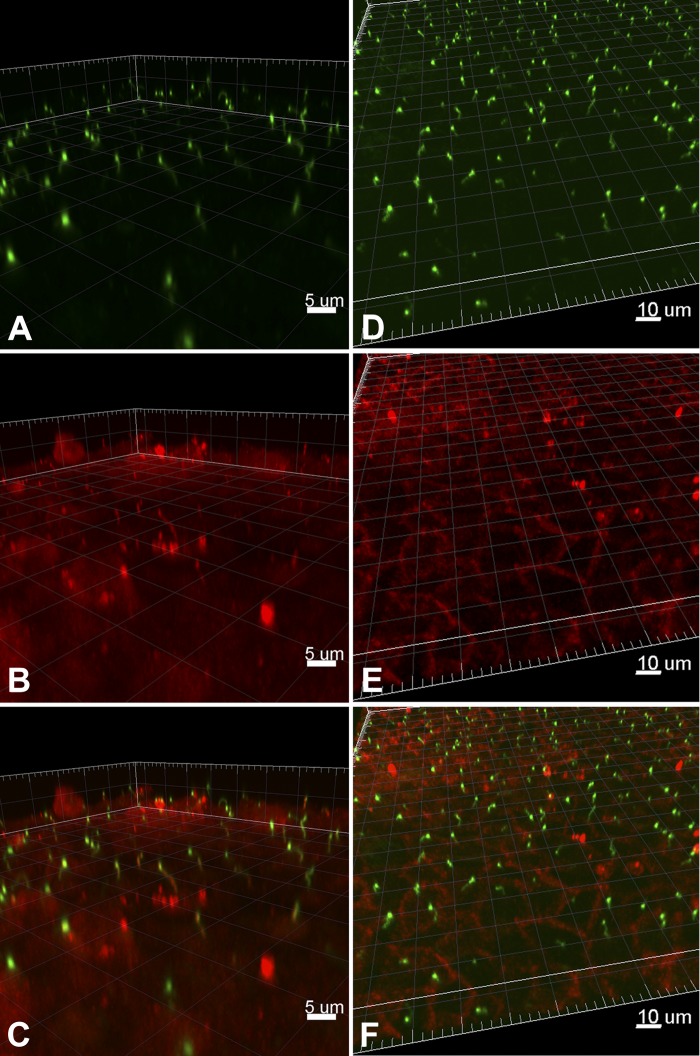
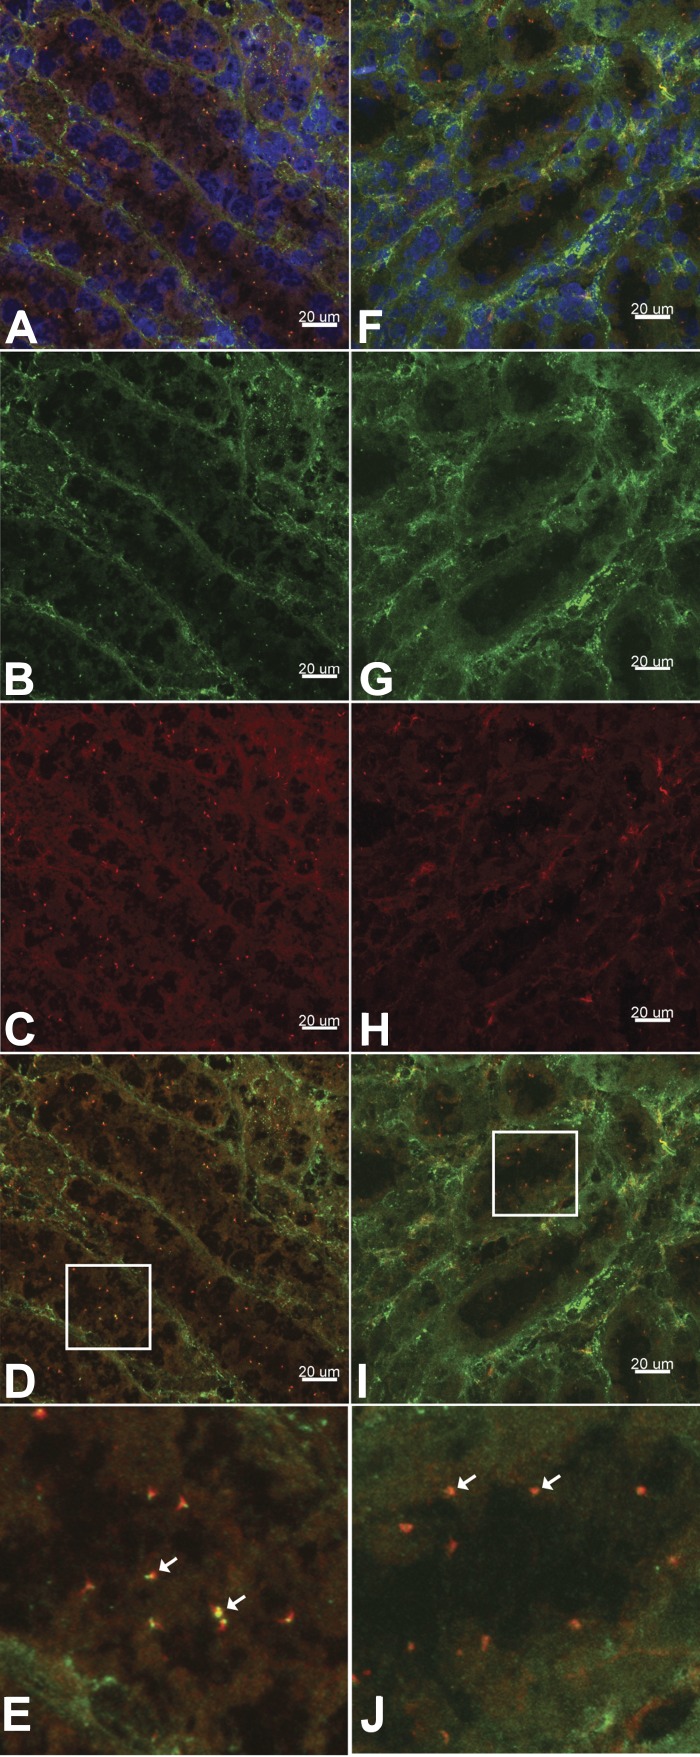
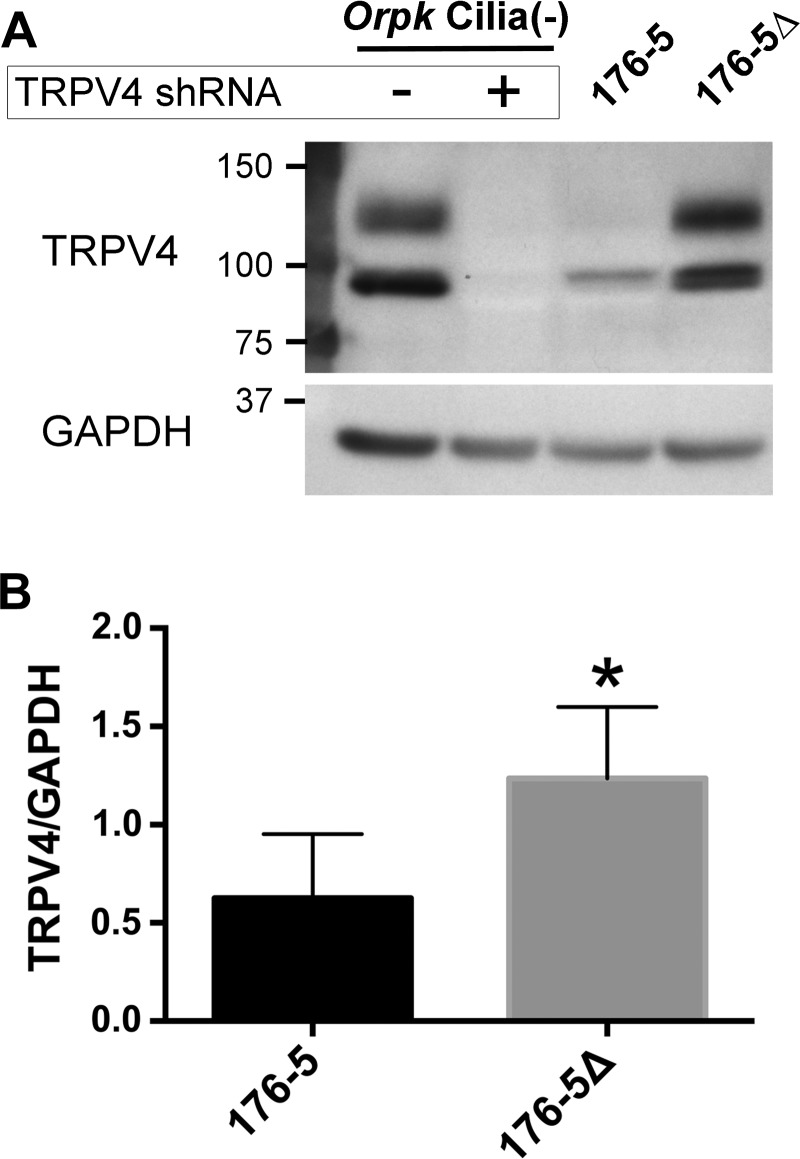
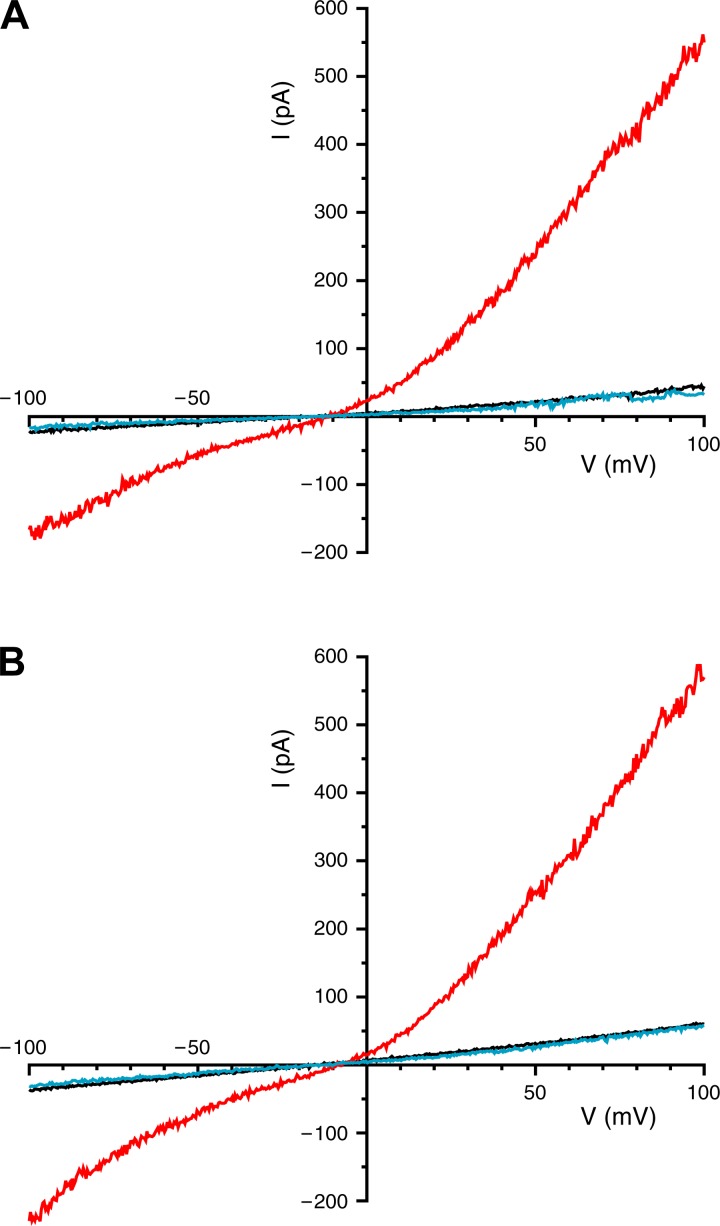
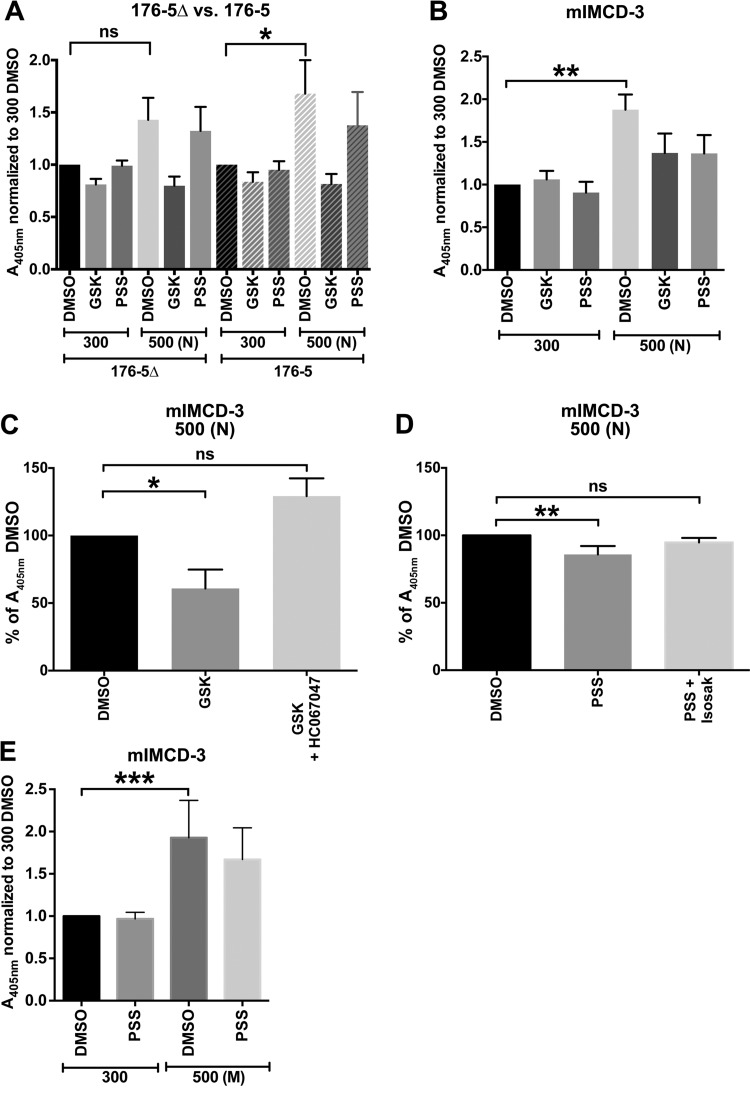
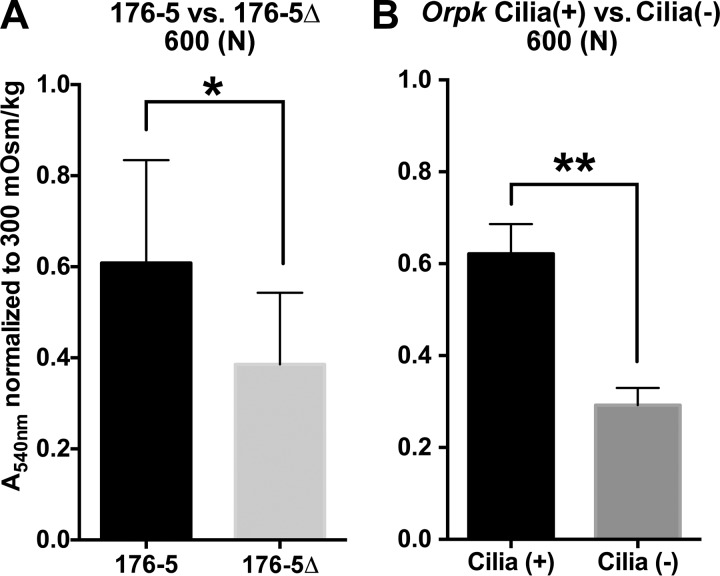
Primary cilia sense environmental conditions, including osmolality, but whether cilia participate in the osmotic response in renal epithelial cells is not known. The transient receptor potential (TRP) channels TRPV4 and TRPM3 are osmoresponsive. TRPV4 localizes to cilia in certain cell types, while renal subcellular localization of TRPM3 is not known. We hypothesized that primary cilia are required for maximal activation of the osmotic response of renal epithelial cells and that ciliary TRPM3 and TRPV4 mediate that response. Ciliated [murine epithelial cells from the renal inner medullary collecting duct (mIMCD-3) and 176-5] and nonciliated (176-5Δ) renal cells expressed Trpv4 and Trpm3 Ciliary expression of TRPM3 was observed in mIMCD-3 and 176-5 cells and in wild-type mouse kidney tissue. TRPV4 was identified in cilia and apical membrane of mIMCD-3 cells by electrophysiology and in the cell body by immunofluorescence. Hyperosmolal stress at 500 mOsm/kg (via NaCl addition) induced the osmotic response genes betaine/GABA transporter (Bgt1) and aldose reductase (Akr1b3) in all ciliated cell lines. This induction was attenuated in nonciliated cells. A TRPV4 agonist abrogated Bgt1 and Akr1b3 induction in ciliated and nonciliated cells. A TRPM3 agonist attenuated Bgt1 and Akr1b3 induction in ciliated cells only. TRPM3 knockout attenuated Akr1b3 induction. Viability under osmotic stress was greater in ciliated than nonciliated cells. Akr1b3 induction was also less in nonciliated than ciliated cells when mannitol was used to induce hyperosmolal stress. These findings suggest that primary cilia are required for the maximal osmotic response in renal epithelial cells and that TRPM3 is involved in this mechanism. TRPV4 appears to modulate the osmotic response independent of cilia.

Keywords: TRPM3; TRPV4; osmoregulation; primary cilium.


Figures

Fig. 10.
Fig. 10.
Hyperosmolality-induced expression of Akr1b3 (aldose reductase) mRNA is affected by activation or expression of TRPM3. mIMCD-3 cells in which Trpm3 was deleted by CRISPR/Cas9 genome editing [TRPM3 knockout (KO)], as well as wild-type (WT) mIMCD-3 cells, were treated for 16 h with 0.1% DMSO or a TRPM3 agonist [100 μM pregnenolone sulfate (PSS)] at 300 mOsm/kg or 500 mOsm/kg [adjusted with NaCl (N)]. RT-qPCR was performed to determine mRNA expression relative to the reference gene B2m. Hyperosmolal stress induced Akr1b3 expression in both cell lines, but the response was greater in WT than TRPM3 KO cells. The TRPM3 agonist attenuated hyperosmolality-induced Akr1b3 expression in WT, but not TRPM3 KO, cells. %Significantly different (P < 0.05, by Student-Newman-Keuls method) from all other conditions. &Significantly different from all conditions except each other. No other comparisons were significantly different. n = 5 experiments.
Fig. 1.
Fig. 1.
Transient receptor potential (TRP) melastatin-3 (Trpm3) mRNA expression in renal cells. A: Trpm3 mRNA is detected by RT-PCR in a murine inner medullary collecting duct (mIMCD-3) RNA sample treated with reverse transcriptase (RT), but not in an untreated sample. PCR products were subjected to electrophoresis on a 4% agarose gel stained with ethidium bromide. Expected size of the Trpm3 quantitative PCR (qPCR) product is 145 bp. Trpm3 mRNA was also detected in RT reactions from 3 additional, independent mIMCD-3 cultures (data not shown). B: as measured by RT-qPCR, expression of Trpm3 mRNA was significantly less (P < 0.008, t-test) in ciliated (176-5) than nonciliated (176-5Δ) renal cells, regardless of which reference gene was used: β2-microglobulin (B2m) or ATP synthase subunit β (Atp5b). Fold change (nonciliated/ciliated) is noted above each pair of conditions; average change was 3.8-fold. For B, n = 3 experiments.
Fig. 5.
Fig. 5.
Trpv4 mRNA expression in renal cells. A: Trpv4 mRNA was detected by RT-PCR in a mIMCD-3 RNA sample treated with reverse transcriptase (RT) but not in an untreated sample. PCR products were subjected to electrophoresis on a 4% agarose gel stained with ethidium bromide. The 79-bp PCR product migrated a bit more slowly than the 80-bp marker, but its identity was confirmed with sequencing. Trpv4 mRNA was also detected in RT reactions from 3 additional, independent mIMCD-3 cultures (data not shown). B: as measured by RT-qPCR, expression of Trpv4 mRNA was similar in ciliated (176-5) and nonciliated (176-5Δ) renal cells, regardless of which reference gene was used: succinate dehydrogenase complex flavoprotein subunit A (Sdha) or B2m (P > 0.5, t-test). For B, n = 3 experiments.
Fig. 9.
Fig. 9.
Hyperosmolality-induced expression of Akr1b3 (aldose reductase) and Slc6a12 [betaine/GABA transporter (Bgt1)] mRNA is affected by the presence of cilia and by stimulation of TRPV4 or TRPM3. A and B: ciliated (176-5) and nonciliated (176-5Δ) renal epithelial cells were treated for 16 h with 0.1% DMSO, a TRPV4 agonist [100 nM GSK1016790A (GSK)], or a TRPM3 agonist [100 μM pregnenolone sulfate (PSS)] at 300 mOsm/kg or 500 mOsm/kg [adjusted with NaCl (N)]. RT-qPCR was performed to determine mRNA expression relative to the reference gene B2m. Hyperosmolal stress induced Akr1b3 and Slc6a12 expression in both cell lines, but the response was greater in ciliated than nonciliated cells. The TRPV4 agonist abrogated hyperosmolality-induced Akr1b3 and Slc6a12 expression in both cell lines (although abrogation of Akr1b3 was not significant for the nonciliated cells). The TRPM3 agonist attenuated hyperosmolality-induced Akr1b3 and Slc6a12 expression only in ciliated cells. C and D: to examine a second cell line, expression of Akr1b3 and Slc6a12 was measured in Orpk cilia(+) and cilia(−) renal epithelial cells exposed to isosmolal (300 mOsm/kg) and hyperosmolal [500 mOsm/kg; adjusted with NaCl (N)] conditions. Hyperosmolality-induced expression of Akr1b3 was enhanced by the presence of cilia. A trend toward increased hyperosmolality-induced Slc6a12 expression was observed in Orpk cilia(+) cells compared with cilia(−) cells, but the increase did not reach statistical significance. Expression is relative to the reference gene Sdha. ND,  not detectable. E: to examine another osmolyte, expression of Akr1b3 was measured in Orpk cilia(+) and cilia(−) renal epithelial cells with osmolality increased to 500 mOsm/kg by addition of mannitol (M), rather than NaCl. Mannitol-induced expression of Akr1b3 was enhanced by the presence of cilia. Expression is relative to the reference gene Sdha. %Significantly different (P < 0.05, by Student-Newman-Keuls method) from all other conditions. &Significantly different from all conditions except each other. No other comparisons were significantly different. n = 3 (A, B, and E) and 4 (C and D) experiments.
Fig. 2.
Fig. 2.
TRPM3 and TRP vanilloid-4 (TRPV4) cellular localization in 176-5Δ and 176-5 cells. A: immunofluorescence was performed using primary antibodies directed against acetylated α-tubulin (green) and TRPM3 (red), and images were overlaid (Merged). Images were obtained using a Zeiss LSM710 confocal microscope and analyzed using Imaris Scientific 3D/4D Image Analysis software. Top: in 176-5 cells, arrows indicate the presence of cilia (left), ciliary TRPM3 (middle), and colocalization (right). Scale bars = 5 µm. Middle: magnified view of the area within the white box in top row. Bottom: 176-5Δ cells were devoid of primary cilia (green, left), and TRPM3 expression was observed diffusely throughout the cells (middle and right). Scale bars = 10 µm. B: immunofluorescence was performed using primary antibodies directed against acetylated α-tubulin (green) and TRPV4 (red), and images were overlaid (Merged). Images were obtained and analyzed as described in A. Top: primary cilia were observed in 176-5 cells (green, left); cell body (possibly plasma membrane) expression of TRPV4 expression was apparent (red, middle), but no ciliary expression of TRPV4 was observed (right). Middle: magnified view of the area within the white box in top row. Bottom: 176-5Δ cells were devoid of primary cilia (green, left); cell body expression of TRPV4 resembled that of 176-5 cells (middle and right). Scale bars = 10 µm.
Fig. 3.
Fig. 3.
TRPM3 (A–C) and TRPV4 (D–F) cellular localization in mIMCD-3 cells. A and B: immunofluorescence was performed using primary antibodies directed against acetylated α-tubulin (A, green) and TRPM3 (B, red). Images were obtained using a Nikon A1 inverted confocal microscope and analyzed using Imaris Scientific 3D/4D Image Analysis software. C: overlaid image of A and B demonstrates TRPM3 coexpression with acetylated α-tubulin (yellow), indicating localization on primary cilia. D and E: immunofluorescence was performed using primary antibodies directed against acetylated α-tubulin (D, green) and TRPV4 (E, red). Images were obtained and analyzed as described in A and B. F: overlaid image of D and E demonstrating no coexpression of TRPV4 with acetylated α-tubulin.
Fig. 4.
Fig. 4.
TRPM3 cellular localization in wild-type mouse kidney tissue. A–E: frozen tissue sections were subjected to immunofluorescence using primary antibodies directed against acetylated α-tubulin (green, A, B, D, and E) and TRPM3 (red, A, C, D, and E). Nuclei were labeled with DAPI (blue, A). TRPM3 coexpression with acetylated α-tubulin (yellow, D and E) indicates localization on primary cilia. F–J: frozen tissue sections were subjected to immunofluorescence using primary antibodies directed against γ-tubulin (green, F, G, I, and J) and TRPM3 (red, F, H, I, and J). Nuclei were labeled with DAPI (blue, F). TRPM3 coexpression with γ-tubulin (yellow, I and J) supports ciliary localization of the channel. Images were obtained using a Nikon A1 inverted confocal microscope and analyzed using Imaris Scientific 3D/4D Image Analysis software. E and J: magnified views of areas in white boxes in D and I, respectively. White arrows indicate coexpression.
Fig. 6.
Fig. 6.
TRPV4 protein expression in 176-5Δ and 176-5 cells. A: Western blot of TRPV4 expression in ciliated 176-5 and nonciliated 176-5Δ cells (lanes 3 and 4) and in Orpk cilia(−) cells with and without stable expression of a TRPV4-targeted shRNA construct (lanes 1 and 2) as an antibody control (54). A band for TRPV4 was observed just below 100 kDa, which is consistent with the predicted molecular weight (48). A higher-molecular-weight band was observed between 100 and 150 kDa, which is consistent with a glycosylated form of TRPV4 (49). Expression of both TRPV4 bands was eliminated in Orpk cilia(−) cells expressing the TRPV4-targeted construct. B: densitometric analysis of TRPV4 expression in 176-5 and 176-5Δ cells normalized to GAPDH levels. *P < 0.05. n = 5 experiments.
Fig. 7.
Fig. 7.
TRPV4-dependent currents (I) in an excised inside-out patch from the apical membrane (A) and in an excised single primary cilium (B), both from mIMCD-3 cells. Recordings were obtained under each of 3 conditions: control (black trace), in the presence of the TRPV4 agonist (GSK1016790A, 100 nM; red trace), and in the presence of both the agonist (100 nM) and a TRPV4 antagonist (HC-067047, 1 µM; blue trace). Reagents were applied to the cytoplasmic face of the membrane.
Fig. 8.
Fig. 8.
Hyperosmolality-induced tonicity element-binding protein (TonEBP) reporter activity is affected by expression of cilia and stimulation of TRPV4 or TRPM3. A: ciliated (176-5) and nonciliated (176-5Δ) pSEAP2TonE/pcDNA3.1-transfected cells in 96-well plates were treated with a TRPV4 agonist [100 nM GSK1016790A (GSK)] or a TRPM3 agonist [100 μM pregnenolone sulfate (PSS)] at 300 mOsm/kg or 500 mOsm/kg [adjusted with NaCl (N)]. Vehicle control groups were treated with 0.1% DMSO. TonEBP activity (normalized to control) was significantly induced in 176-5 cells only. This significant induction was not observed in groups treated with the TRPV4 agonist and the TRPM3 agonist in these cells. A405, absorbance at 405 nm. B: mIMCD-3 cells transfected with pSEAP2TonE/pcDNA3.1 were treated with a TRPV4 agonist (25 nM GSK1016790A) or a TRPM3 agonist (100 μM pregnenolone sulfate) at 300 mOsm/kg or 500 mOsm/kg (adjusted with NaCl). Vehicle control groups were treated with 0.1% DMSO. Hyperosmolality significantly induced TonEBP reporter activity, which was not observed in groups treated with the TRPV4 agonist and the TRPM3 agonist. C and D: agonist-mediated attenuation of hyperosmolality-induced TonEBP reporter activity was competed away by cotreatment with the TRPV4 antagonist HC-067047 and by the TRPM3 antagonist isosakuranetin (Isosak). E: in mIMCD-3 cells, increasing osmolality to 500 mOsm/kg [adjusted with mannitol (M)] produced a statistically significant increase in TonEBP reporter activity that was not significant with concurrent treatment with the TRPM3 agonist. Treatment groups were compared with controls using Friedman’s test with Dunn’s correction for multiple comparisons. *P < 0.05, **P < 0.01, ***P < 0.001. ns, Not significant. n = 10 (A), 6 (B–D), and 9 (E) experiments.
Fig. 11.
Fig. 11.
Crystal violet cell quantitation of 176-5 and 176-5Δ (A) and Orpk cilia(+) and cilia(−) cells (B). Greater absorbance (A540) values indicate greater number of cells. 176-5 and 176-5Δ and Orpk cilia(+) and cilia(−) cells were acutely exposed to isosmolal (300 mOsm/kg) and hyperosmolal [600 mOsm/kg, with addition of NaCl (N) to basal medium] conditions for 24 h. Absorbance values were normalized to isosmolal control (300 mOsm/kg) groups. *P < 0.05, **P < 0.01. n = 9 (A) and 4 (B) experiments.

References

    1. Bagnasco S, Balaban R, Fales HM, Yang YM, Burg M. Predominant osmotically active organic solutes in rat and rabbit renal medullas. J Biol Chem 261: 5872–5877, 1986. - PubMed
    1. Becker D, Blase C, Bereiter-Hahn J, Jendrach M. TRPV4 exhibits a functional role in cell-volume regulation. J Cell Sci 118: 2435–2440, 2005. doi:10.1242/jcs.02372. - DOI - PubMed
    1. Berbari NF, O’Connor AK, Haycraft CJ, Yoder BK. The primary cilium as a complex signaling center. Curr Biol 19: R526–R535, 2009. doi:10.1016/j.cub.2009.05.025. - DOI - PMC - PubMed
    1. Berbari NF, Sharma N, Malarkey EB, Pieczynski JN, Boddu R, Gaertig J, Guay-Woodford L, Yoder BK. Microtubule modifications and stability are altered by cilia perturbation and in cystic kidney disease. Cytoskeleton 70: 24–31, 2013. doi:10.1002/cm.21088. - DOI - PMC - PubMed
    1. Burg MB, Ferraris JD, Dmitrieva NI. Cellular response to hyperosmotic stresses. Physiol Rev 87: 1441–1474, 2007. doi:10.1152/physrev.00056.2006. - DOI - PubMed

Publication types

MeSH terms