. 2017 Mar 16;129(11):e26-e37.
doi: 10.1182/blood-2016-09-738070. Epub 2017 Jan 25.

Ex vivo drug response profiling detects recurrent sensitivity patterns in drug-resistant acute lymphoblastic leukemia

Affiliations

Ex vivo drug response profiling detects recurrent sensitivity patterns in drug-resistant acute lymphoblastic leukemia

Viktoras Frismantas et al. Blood. .

Abstract

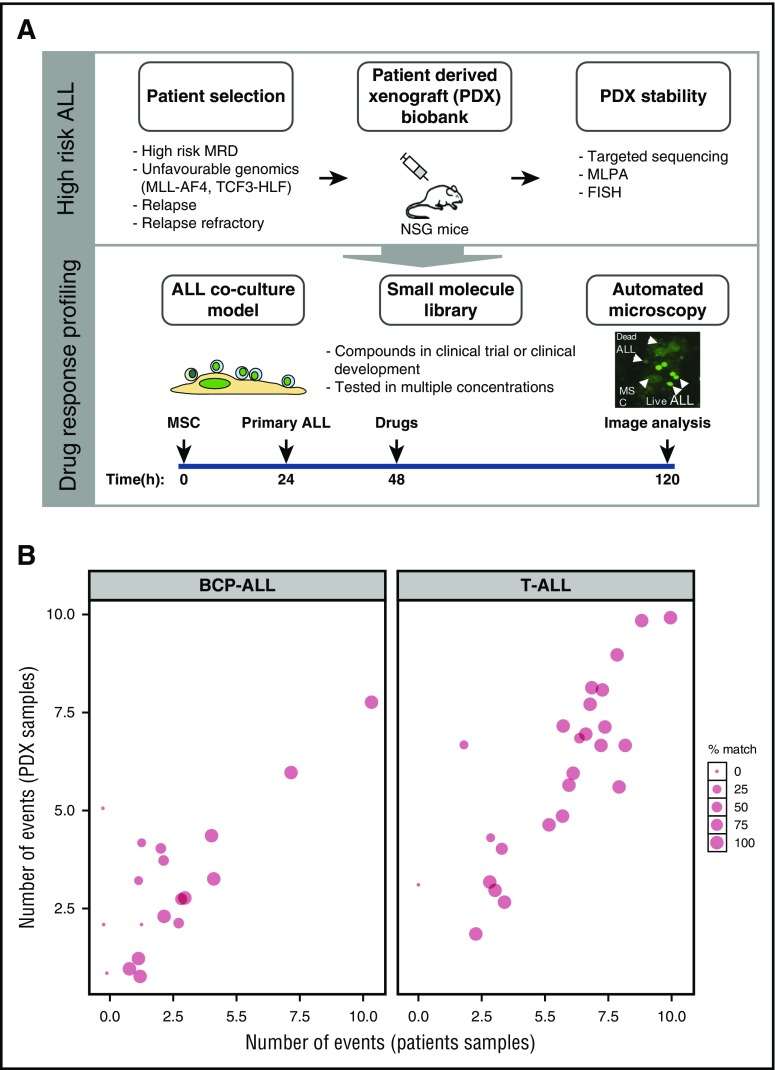
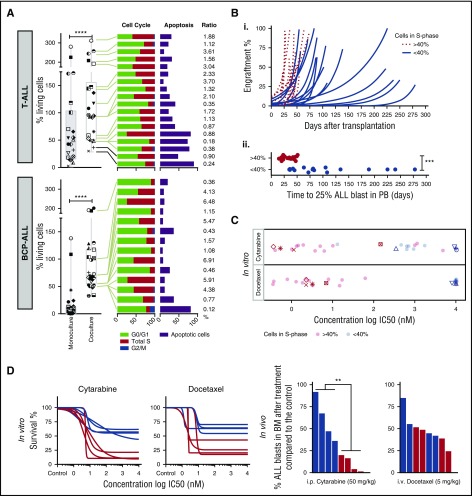
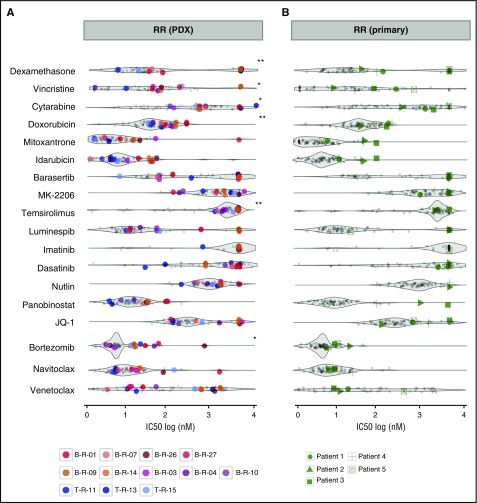
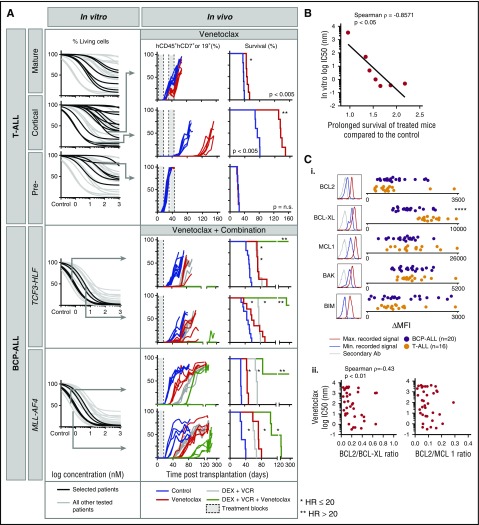
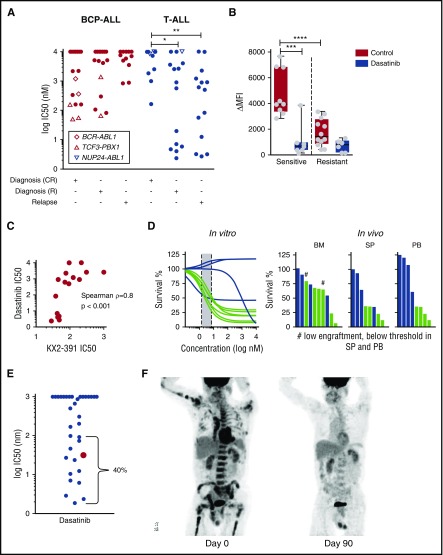
Drug sensitivity and resistance testing on diagnostic leukemia samples should provide important functional information to guide actionable target and biomarker discovery. We provide proof of concept data by profiling 60 drugs on 68 acute lymphoblastic leukemia (ALL) samples mostly from resistant disease in cocultures of bone marrow stromal cells. Patient-derived xenografts retained the original pattern of mutations found in the matched patient material. Stromal coculture did not prevent leukemia cell cycle activity, but a specific sensitivity profile to cell cycle-related drugs identified samples with higher cell proliferation both in vitro and in vivo as leukemia xenografts. In patients with refractory relapses, individual patterns of marked drug resistance and exceptional responses to new agents of immediate clinical relevance were detected. The BCL2-inhibitor venetoclax was highly active below 10 nM in B-cell precursor ALL (BCP-ALL) subsets, including MLL-AF4 and TCF3-HLF ALL, and in some T-cell ALLs (T-ALLs), predicting in vivo activity as a single agent and in combination with dexamethasone and vincristine. Unexpected sensitivity to dasatinib with half maximal inhibitory concentration values below 20 nM was detected in 2 independent T-ALL cohorts, which correlated with similar cytotoxic activity of the SRC inhibitor KX2-391 and inhibition of SRC phosphorylation. A patient with refractory T-ALL was treated with dasatinib on the basis of drug profiling information and achieved a 5-month remission. Thus, drug profiling captures disease-relevant features and unexpected sensitivity to relevant drugs, which warrants further exploration of this functional assay in the context of clinical trials to develop drug repurposing strategies for patients with urgent medical needs.


Figures

Figure 1.
Figure 1.
Setup of the drug response profiling platform. (A, top panel) Patient material, notably from high-risk patients, including relapse patients and patients with translocations linked to poor survival, were prioritized for PDX and drug response profiling; PDX stability was evaluated against primary material by comparing targeted deep-sequenced leukemogenesis markers. (A, bottom panel) Drug profiling was performed on primary ALL cells in coculture with bone marrow–derived MSCs. Automated microscopy-based image analysis was used to quantify living ALL cells and generate dose-response curves. Imaging results were analyzed with a toolkit that performed dose-response normalization, outlier removal, rapid curve fitting, and extraction of response parameters (IC50, area under the curve, Emax, which corresponds to the percentage of viable cells at the maximum dose of the drug). Selected single compounds and combinations were validated in the xenograft model. This platform enabled the identification of drug-response phenotypes in individual ALL patients, providing an additional layer of information to facilitate individual treatment approaches. (B) Our PDX model preserves an average of 74% of the mutations and insertions/deletions initially detected in patients, making it an ideal source of material for drug-response testing in multicenter, co-clinical settings. MLPA, multiplex ligation-dependent probe amplification; FISH, fluorescent in situ hybridization.
Figure 2.
Figure 2.
Drug response profiles of BCP-ALL and T-ALL. Heatmap indicating the response of BCP-ALL (n = 44) and T-ALL (n = 24) to 60 compounds and represented by IC50 values. Samples (rows) were ordered according to clinical classification, and compounds (columns) were ordered according to activity. The IC50 distribution range for each compound is shown on the lower panel forming drug clusters. (A) Generally active drugs, mean IC50 values <10 nM. (B) Drugs more active in BCP-ALLs than T-ALLs. (C) Generally active drugs with IC50 values <100 nM. (D) Drugs with variable activity. (E) Drugs with activity linked to cycling activity. (F) Generally active drugs with high nanomolar range. (G) Generally inactive drugs, with sporadic exceptions. Heatmap of MSCs and drug IC50 distribution box plot are shown on the lower part of the graph.
Figure 3.
Figure 3.
Drug profiling reveals leukemia-intrinsic features. (A) Coculturing on MSCs supports survival of T-ALL (n = 22) and BCP-ALL (n = 25). Data at day 4 are given, normalized to seeded viable cell numbers at day 0 in both monoculture and coculture (left panel). The symbols identify the patients in the 2 culture conditions. Cell cycle and apoptosis rates of primary T-ALL (n = 18) and BCP-ALL (n = 14) cells in coculture are provided on the right. Samples are ranked from highest (top) to lowest (bottom) survival. Ratio of cells in S phase and apoptosis is given on the far right. (B) Engraftment kinetics for ALL cases with >40% and <40% of cells in S phase are given (i). Time to engraftment with 25% ALL blasts in the 2 groups is indicated in the lower panel (ii). (C) In vitro ALL proliferation correlates with drug response to cytarabine (antimetabolite), docetaxel (antimitotic), and other drugs that target the cell cycle (supplemental Figure 4). ALL cells with >40% of cells in S phase respond to cytarabine and docetaxel with lower IC50 compared with samples with <40% of cells in S phase. (D) Cytarabine and docetaxel response profiles predict in vivo ALL response (n = 8). ****P < .001 (paired Student t test); ***P < .001 (2-sided Student t test); **P = .0087. i.p., intraperitoneal; i.v., intraveous; PB, peripheral blood.
Figure 4.
Figure 4.
Distinct drug activity patterns can be detected for individual samples and patient groups of interest. (A) RR PDX (n = 12) samples exhibit general resistance to conventional clinical compounds but remain sensitive to some experimental drugs. (B) Primary RR patients (n = 5) tested before last salvage therapy demonstrate persistent resistance to standard chemotherapy and individual sensitivity to experimental molecules. All responses are represented as IC50 (log[nM]) and are compared with other diagnostic and relapse ALL patients depicted in the background. **P < .005 (2-sided Student t test); *P < .05.
Figure 5.
Figure 5.
In vitro sensitivity to the BCL-2 antagonist venetoclax correlates with the response in leukemia xenografts. (A) In vitro response to venetoclax for indicated ALL subtypes (black) compared with other ALL (gray). From top to bottom: mature T-ALL (n = 6), cortical T-ALL (n = 13), pre-T-ALL (n = 6), TCF3-HLF ALL (n = 4), and MLL-AF4 ALL (n = 3). Cell viability (7-aminoactinomycin D) was measured by flow cytometry after 72 hours of treatment and was normalized against controls treated with dimethyl sulfoxide. Arrows indicate samples whose response had been validated in vivo for venetoclax (top to bottom: T-VHR-03, T-HR-11, and T-HR-10) or venetoclax in combination with vincristine and dexamethasone (top to bottom: B-HR-24, B-HR-20, B-HR-26, and B-VHR-07). The left panel shows the number of leukemia cells compared with mouse lymphocytes over time. The right panel shows corresponding Kaplan-Meier survival curves (event defined as 25% of mCD45hCD45+hCD19+ or hCD7+ leukemia cells detected by flow cytometry). (B) In vitro response to venetoclax correlates with fold increase of survival comparing treatment with venetoclax with treatment with vehicle (n = 7). (C) BCL2 protein family expression (i) analyzed by flow cytometer in T-ALL (n = 16) and BCP-ALL (n = 20). Correlation of BCL2:BCL-XL and BCL2:MCL1 ratio (ii) with in vitro venetoclax response. ****P < .001 (2-tailed Student t test). Ab, antibody; HR, hazard ratio; Max., maximum; MFI, mean fluorescent intensity; Min., minimum.
Figure 6.
Figure 6.
In vitro sensitivity of T-ALL to dasatinib correlates with antileukemic efficacy in the patient. (A) Subset of T-ALL patients at diagnosis that relapsed (R) and at relapse are highly sensitive to dasatinib in vitro. (B) Dasatinib-sensitive T-ALL cells have higher levels of phosphorylated SRC that decreases after treatment with 1 µM dasatinib for 2 hours as measured by flow cytometry. (C) Dasatinib response correlates with sensitivity to the SRC inhibitor KX2-391 (n = 16). (D) In vitro captured response correlates with in vivo response to dasatinib (n = 10). Indicated is the percent of T-ALL blasts compared with mouse lymphocytes normalized to vehicle-treated controls. (E) Sensitivity of adult and pediatric T-ALL patients to dasatinib reveals 40% of patients with IC50 below 100 nM. (F) Left: positron emission tomography/computed tomography (PET/CT) scan demonstrates significant disease burden throughout the marrow in bilateral upper and lower extremities, the pelvis, vertebrae, and contiguous nodes within the mediastinum. Right: PET/CT ∼15 months after the original presentation, shortly after initiation of dasatinib monotherapy. This image demonstrates complete response (CR) with no signs of marrow or nodal involvement. *P = .0272; **P = .0072; ***P = .0004; ****P = .0001. BM, bone marrow; PB, peripheral blood; SP, spleen.

References

    1. Locatelli F, Schrappe M, Bernardo ME, Rutella S. How I treat relapsed childhood acute lymphoblastic leukemia. Blood. 2012;120(14):2807-2816. - PubMed
    1. Inaba H, Greaves M, Mullighan CG. Acute lymphoblastic leukaemia. Lancet. 2013;381(9881):1943-1955. - PMC - PubMed
    1. Roberts KG, Li Y, Payne-Turner D, et al. . Targetable kinase-activating lesions in Ph-like acute lymphoblastic leukemia. N Engl J Med. 2014;371(11):1005-1015. - PMC - PubMed
    1. Holmfeldt L, Wei L, Diaz-Flores E, et al. . The genomic landscape of hypodiploid acute lymphoblastic leukemia. Nat Genet. 2013;45(3):242-252. - PMC - PubMed
    1. Shochat C, Tal N, Bandapalli OR, et al. . Gain-of-function mutations in interleukin-7 receptor-α (IL7R) in childhood acute lymphoblastic leukemias. J Exp Med. 2011;208(5):901-908. - PMC - PubMed

MeSH terms

Substances