. 2017 Feb;149(2):249-260.
doi: 10.1085/jgp.201611701. Epub 2017 Jan 25.

The intrinsically liganded cyclic nucleotide-binding homology domain promotes KCNH channel activation

Affiliations

The intrinsically liganded cyclic nucleotide-binding homology domain promotes KCNH channel activation

Yaxian Zhao et al. J Gen Physiol. 2017 Feb.

Abstract

Channels in the ether-à-go-go or KCNH family of potassium channels are characterized by a conserved, C-terminal domain with homology to cyclic nucleotide-binding homology domains (CNBhDs). Instead of cyclic nucleotides, two amino acid residues, Y699 and L701, occupy the binding pocket, forming an "intrinsic ligand." The role of the CNBhD in KCNH channel gating is still unclear, however, and a detailed characterization of the intrinsic ligand is lacking. In this study, we show that mutating both Y699 and L701 to alanine, serine, aspartate, or glycine impairs human EAG1 channel function. These mutants slow channel activation and shift the conductance-voltage (G-V) relation to more depolarized potentials. The mutations affect activation and the G-V relation progressively, indicating that the gating machinery is sensitive to multiple conformations of the CNBhD. Substitution with glycine at both sites (GG), which eliminates the side chains that interact with the binding pocket, also reduces the ability of voltage prepulses to populate more preactivated states along the activation pathway (i.e., the Cole-Moore effect), as if stabilizing the voltage sensor in deep resting states. Notably, deletion of the entire CNBhD (577-708, ΔCNBhD) phenocopies the GG mutant, suggesting that GG is a loss-of-function mutation and the CNBhD requires an intrinsic ligand to exert its functional effects. We developed a kinetic model for both wild-type and ΔCNBhD mutant channels that describes all our observations on activation kinetics, the Cole-Moore shift, and G-V relations. These findings support a model in which the CNBhD both promotes voltage sensor activation and stabilizes the open pore. The intrinsic ligand is critical for these functional effects.


Figures

Figure 1.
Figure 1.
Domains of hEAG1 channel and CNBHD structure. (A) Schematic showing domains of hEAG1. Region deleted in ΔCNBhD mutant is marked by arrowheads. (B) Cartoon representation of the structure of the CNBhD from mEAG1 channel (adapted from Marques-Carvalho et al., 2012; PDB accession no. 4F8A). C-linker stretch is depicted in green, CNBhD helices are in blue, and β-roll is in gray. Residues forming the intrinsic ligand are shown in magenta.
Figure 2.
Figure 2.
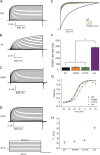
The intrinsic ligand exerts a synergistic impact on hEAG1 channel gating. Two-electrode voltage clamp current recorded from oocytes expressing WT (A), Y699A-L701A (B), Y699A (C), and L701A (D). All currents were recorded at room temperature in response to a series of 1-s depolarizing voltage steps ranging from −100 to 80 mV from a holding potential of −80 mV. (E) Overlaid normalized current traces of WT, Y699A, L701A, and Y699A-L701A. (F) Summary of 20–80% rise times for current activation at 60 mV (*, P < 0.05). (G) Normalized peak conductance (see Materials and methods) plotted as a function of test voltage. Data were fitted with a Boltzmann function (curves). (H) Summary of the V1/2 from Boltzmann fits as shown in G. n = 8 (WT), 6 (Y699A-L701A), 5 (Y699A), and 7 (L701A) oocytes. Data are mean ± SEM.
Figure 3.
Figure 3.
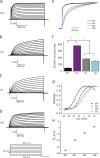
The gating machinery senses different conformations of the CNBhD. (A–D) Representative current traces evoked during 1-s voltage pulses ranging from −100 to 80 mV in 10-mV intervals from a holding potential of −80 mV for WT (A), AA (B), SS (C), and GG channels (D). (E) Overlaid normalized current responses at 60 mV. (F) Summary of 20–80% rise times for current activation at 60 mV (*, P < 0.05). (G) Normalized peak conductance plotted as a function of test voltage. Data were fitted with a Boltzmann function (see Materials and methods). (H) Summary of the V1/2 derived from Boltzmann fits as shown in G. n = 8 (WT), 7 (AA), 8 (GG), and 6 (SS) oocytes. Data are mean ± SEM.
Figure 4.
Figure 4.
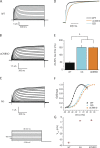
GG mutant phenocopies CNBhD deletion. (A–D) Representative current traces evoked during 1-s voltage pulses ranging from −100 to 80 mV in 10-mV intervals from a holding potential of −80 mV for WT (A), ΔCNBhD (B), and GG (C). (D) Overlaid normalized representative currents triggered at 60 mV. (E) Summary of 20–80% rise times for currents activated at 60 mV for WT and mutants (*, P < 0.05). (F) Normalized peak conductance plotted as a function of test voltage. Data were fitted with a Boltzmann function (see Materials and methods). (G) Summary of V1/2 derived from Boltzmann fits for WT and the mutant channels. n = 8 (WT), 8 (GG), and 10 (ΔCNBhD) oocytes. Data are mean ± SEM.
Figure 5.
Figure 5.
GG and ΔCNBhD behave similarly in response to hyperpolarized prepulses. Representative current traces triggered at 60 mV immediately after a series of voltage steps from −130 to −20 mV for WT (A), ΔCNBhD (B), and GG (C). (D) Normalized time of 20–80% maximum current at 60 mV plotted as a function of prepulse voltage for WT (black), ΔCNBhD (orange), and GG (cyan). n = 5 (WT), 7 (GG), and 4 (ΔCNBhD) oocytes. Data are mean ± SEM.
Figure 6.
Figure 6.
ΔYNL intrinsic ligand deletion and DD mutant phenotypes. (A–C) Representative current traces evoked during 1-s voltage pulses ranging from −100 to 80 mV in 10-mV intervals from a holding potential of −80 mV for WT (A), ΔYNL (B), and DD (C). (D) Normalized conductance plotted as a function of test voltage for WT, ΔYNL, and DD. WT was fitted with the single Boltzmann function (see Materials and methods). ΔYNL and DD were fitted with double Boltzmann function. (E) Summary of V1/2 of WT and mutant channels. V1/2 of the first Boltzmann component (V1) is indicated in blue, and the second component (V2) is in red. n = 8 (WT), 6 (DD), and 7 (ΔYNL) oocytes. Data are mean ± SEM.
Figure 7.
Figure 7.
Gating model for hEAG1 WT and ΔCNBhD channels. (A) Kinetic model for channel gating. The bracketed transitions from C0 to C2 must proceed for each of four independent subunits before pore opening. The blue bracket indicates transitions that contribute to current activation kinetics. The red bracket indicates the transition that contributes to the nonohmic saturation at depolarized potentials (Fig. S2, A and B). Optimized rate constants and associated charges are listed in Table 1. (B, left) Representative currents from WT channels (purple) recorded in response to the protocol shown in Fig. 2 A, overlaid with simulated currents (green) from the model in A. (B, right) the initial 300 ms of the I-V recording shown on an expanded time scale. (C, left) Currents from WT channels (purple) recorded in response to the protocol shown in Fig. 5 A, overlaid with simulated currents (green). (C, right) The initial 350 ms of the Cole–Moore effect shown on an expanded time scale. (D and E) Representative currents from ΔCNBhD channels (purple), overlaid with simulated currents (green) in response to the same protocols shown in B and C, respectively.
Figure 8.
Figure 8.
Contacts in the cytoplasmic gating ring of EAG1. Overall view of the EAG1 channel structure (PDB accession no. 5K7L) on the left with pore domain (gray surface) surrounded by voltage sensor domains (helical representation) at the top and the cytoplasmic gating ring at the bottom (as surface and cartoon representations). On the right, closer view of one of the units that form the cytoplasmic gating ring. The unit is assembled from the N terminus (PAS-cap, PAS domain, and N-linker, in shades of blue) of one channel subunit and the C terminus (C-linker and CNBhD, in shades of red) from another subunit. Domains and channel regions are labeled. Yellow arrows indicate putative pathways for propagation of structural changes affecting the gating mechanism, as discussed in the text.

References

    1. Bannister J.P., Chanda B., Bezanilla F., and Papazian D.M.. 2005. Optical detection of rate-determining ion-modulated conformational changes of the ether-à-go-go K+ channel voltage sensor. Proc. Natl. Acad. Sci. USA. 102:18718–18723. 10.1073/pnas.0505766102 - DOI - PMC - PubMed
    1. Barbuti A., Baruscotti M., Altomare C., Moroni A., and DiFrancesco D.. 1999. Action of internal pronase on the f-channel kinetics in the rabbit SA node. J. Physiol. 520:737–744. 10.1111/j.1469-7793.1999.00737.x - DOI - PMC - PubMed
    1. Brelidze T.I., Carlson A.E., and Zagotta W.N.. 2009. Absence of direct cyclic nucleotide modulation of mEAG1 and hERG1 channels revealed with fluorescence and electrophysiological methods. J. Biol. Chem. 284:27989–27997. 10.1074/jbc.M109.016337 - DOI - PMC - PubMed
    1. Brelidze T.I., Carlson A.E., Sankaran B., and Zagotta W.N.. 2012. Structure of the carboxy-terminal region of a KCNH channel. Nature. 481:530–533. 10.1038/nature10735 - DOI - PMC - PubMed
    1. Brelidze T.I., Gianulis E.C., DiMaio F., Trudeau M.C., and Zagotta W.N.. 2013. Structure of the C-terminal region of an ERG channel and functional implications. Proc. Natl. Acad. Sci. USA. 110:11648–11653. 10.1073/pnas.1306887110 - DOI - PMC - PubMed

Substances

Associated data

LinkOut - more resources