

Intradialytic Cardiac Magnetic Resonance Imaging to Assess Cardiovascular Responses in a Short-Term Trial of Hemodiafiltration and Hemodialysis
- PMID: 28122851
- PMCID: PMC5373461
- DOI: 10.1681/ASN.2016060686
Intradialytic Cardiac Magnetic Resonance Imaging to Assess Cardiovascular Responses in a Short-Term Trial of Hemodiafiltration and Hemodialysis
Abstract
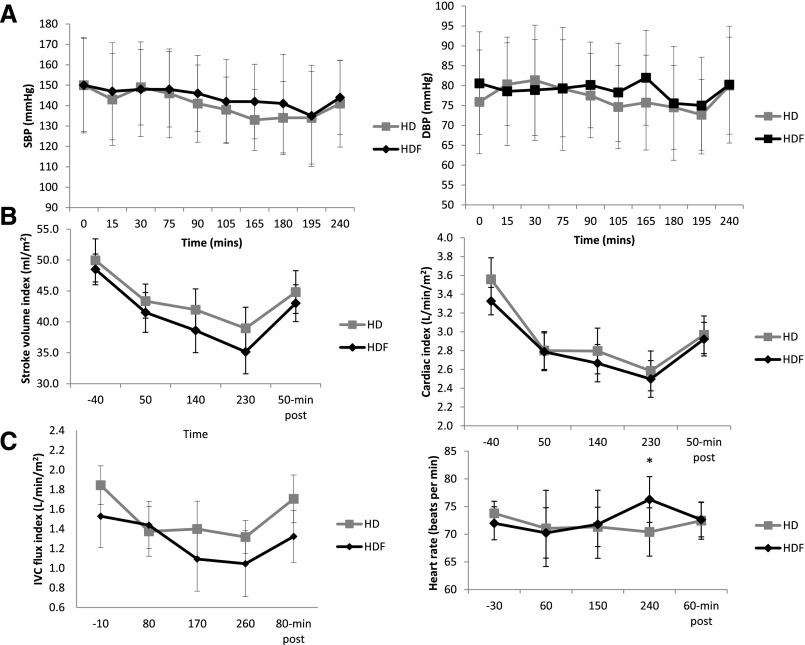
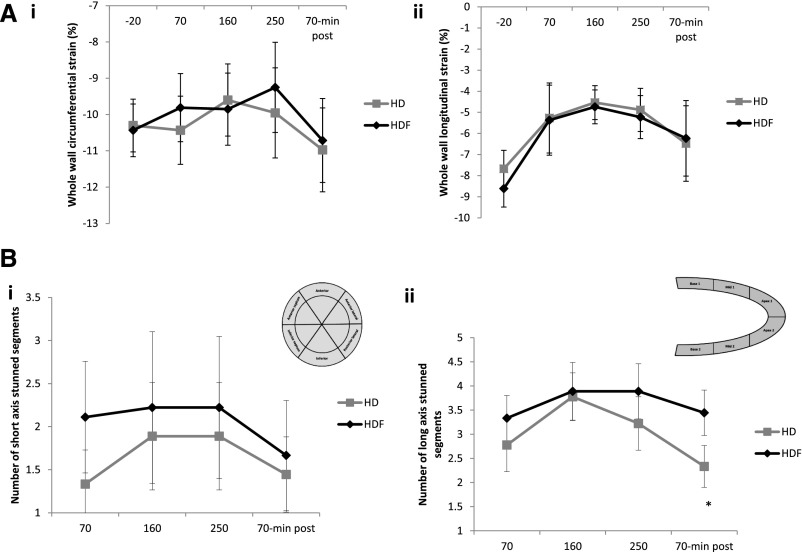
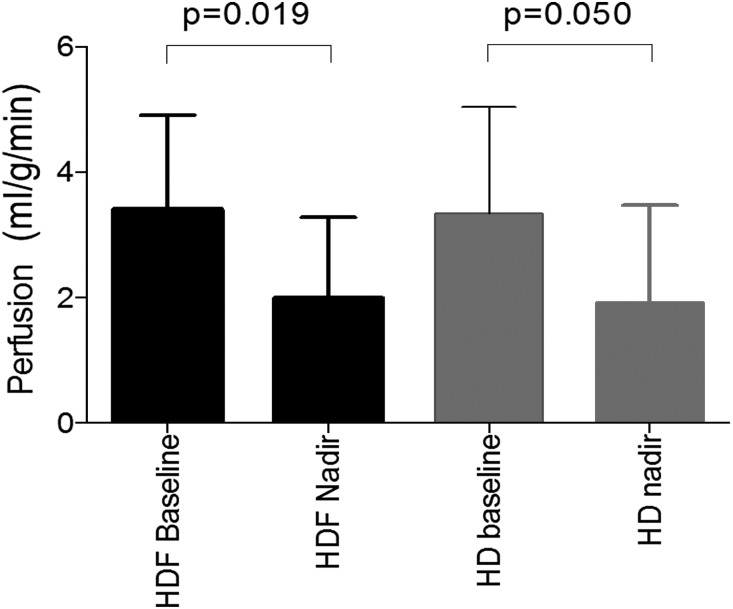
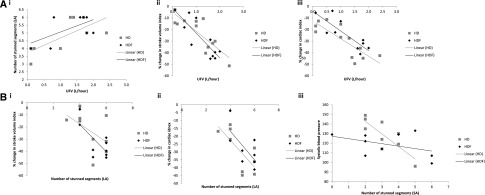
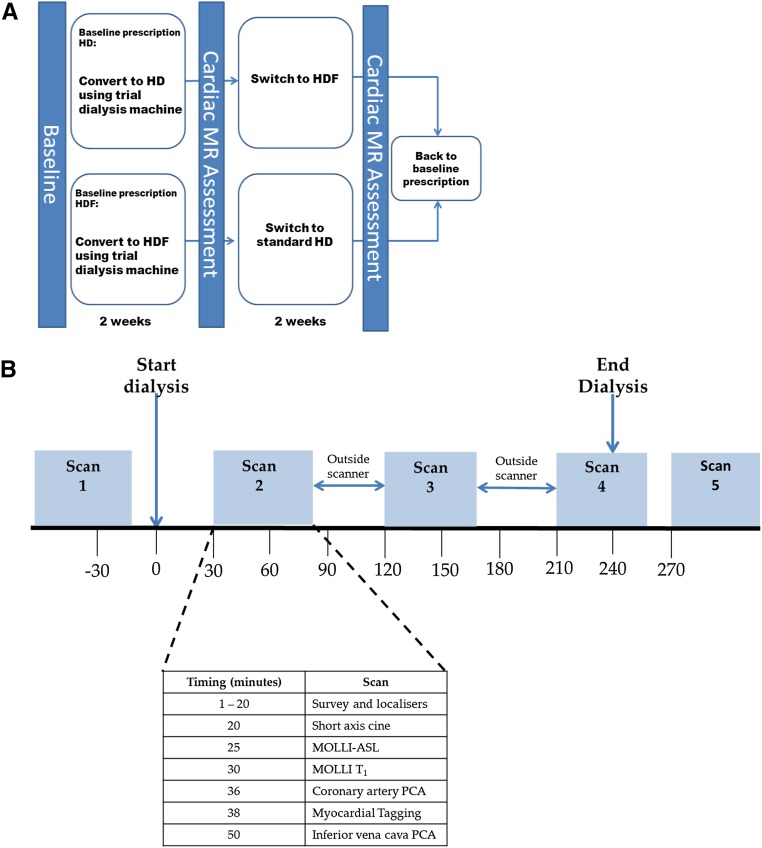
Hemodynamic stress during hemodialysis (HD) results in recurrent segmental ischemic injury (myocardial stunning) that drives cumulative cardiac damage. We performed a fully comprehensive study of the cardiovascular effect of dialysis sessions using intradialytic cardiac magnetic resonance imaging (MRI) to examine the comparative acute effects of standard HD versus hemodiafiltration (HDF) in stable patients. We randomly allocated 12 patients on HD (ages 32-72 years old) to either HD or HDF. Patients were stabilized on a modality for 2 weeks before undergoing serial cardiac MRI assessment during dialysis. Patients then crossed over to the other modality and were rescanned after 2 weeks. Cardiac MRI measurements included cardiac index, stroke volume index, global and regional contractile function (myocardial strain), coronary artery flow, and myocardial perfusion. Patients had mean±SEM ultrafiltration rates of 3.8±2.9 ml/kg per hour during HD and 4.4±2.5 ml/kg per hour during HDF (P=0.29), and both modalities provided a similar degree of cooling. All measures of systolic contractile function fell during HD and HDF, with partial recovery after dialysis. All patients experienced some degree of segmental left ventricular dysfunction, with severity proportional to ultrafiltration rate and BP reduction. Myocardial perfusion decreased significantly during HD and HDF. Treatment modality did not influence any of the cardiovascular responses to dialysis. In conclusion, in this randomized, crossover study, there was no significant difference in the cardiovascular response to HDF or HD with cooled dialysate as assessed with intradialytic MRI.
Keywords: cardiac MRI; hemodiafiltration; hemodialysis; myocardial stunning; randomized controlled trials.
Copyright © 2017 by the American Society of Nephrology.
Figures
Comment in
-
Changes in Cardiac Output and Perfusion during Hemodialysis and Hemodiafiltration Treatments Determined by Cardiac Magnetic Resonance Imaging.J Am Soc Nephrol. 2017 Apr;28(4):1013-1015. doi: 10.1681/ASN.2016111257. Epub 2017 Feb 9. J Am Soc Nephrol. 2017. PMID: 28183725 Free PMC article. No abstract available.
References
-
- Chiu DYY, Green D, Abidin N, Sinha S, Kalra PA: Cardiac imaging in patients with chronic kidney disease. Nat Rev Nephrol 11: 207–220, 2015 - PubMed
-
- Selby NM, McIntyre CW: The acute cardiac effects of dialysis. Semin Dial 20: 220–228, 2007 - PubMed
-
- McIntyre CW: Recurrent circulatory stress: The dark side of dialysis. Semin Dial 23: 449–451, 2010 - PubMed
-
- McIntyre CW: Haemodialysis-induced myocardial stunning in chronic kidney disease - a new aspect of cardiovascular disease. Blood Purif 29: 105–110, 2010 - PubMed
-
- McIntyre CW: Effects of hemodialysis on cardiac function. Kidney Int 76: 371–375, 2009 - PubMed
Publication types
MeSH terms
LinkOut - more resources
Full Text Sources
Other Literature Sources
Medical
