

Conformational equilibria and intrinsic affinities define integrin activation
- PMID: 28122868
- PMCID: PMC5331762
- DOI: 10.15252/embj.201695803
Conformational equilibria and intrinsic affinities define integrin activation
Abstract
We show that the three conformational states of integrin α5β1 have discrete free energies and define activation by measuring intrinsic affinities for ligand of each state and the equilibria linking them. The 5,000-fold higher affinity of the extended-open state than the bent-closed and extended-closed states demonstrates profound regulation of affinity. Free energy requirements for activation are defined with protein fragments and intact α5β1 On the surface of K562 cells, α5β1 is 99.8% bent-closed. Stabilization of the bent conformation by integrin transmembrane and cytoplasmic domains must be overcome by cellular energy input to stabilize extension. Following extension, headpiece opening is energetically favored. N-glycans and leg domains in each subunit that connect the ligand-binding head to the membrane repel or crowd one another and regulate conformational equilibria in favor of headpiece opening. The results suggest new principles for regulating signaling in the large class of receptors built from extracellular domains in tandem with single-span transmembrane domains.
Keywords: N‐glycan; affinity; conformation; integrin; thermodynamics.
© 2017 The Authors. Published under the terms of the CC BY 4.0 license.
Figures
- A–C
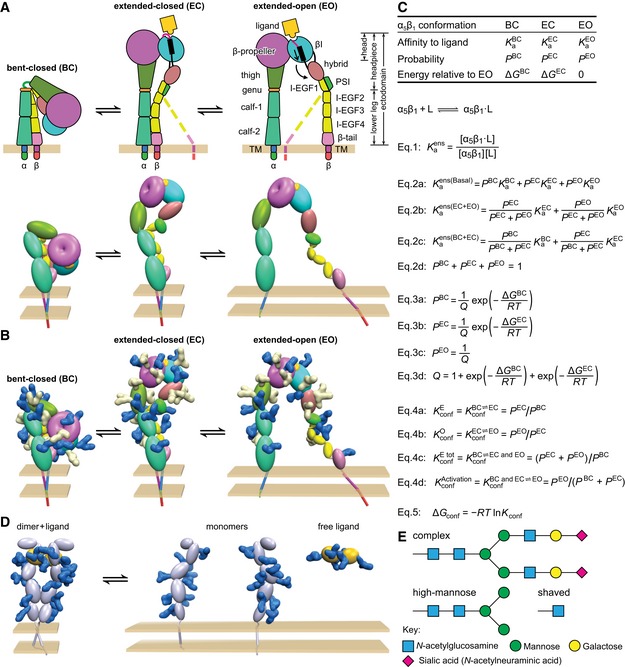
Integrins. (A) Integrin structure and arrangement of domains in the three overall states of the conformational ensemble (Luo et al, 2007), with dashed lines representing the flexibility of the lower β‐leg in extended conformations (schematic, upper). In the Pymol representation (lower), structures based on intact, bent‐closed integrin αVβ3 on the cell surface (Zhu et al, 2009), in the same integrin subfamily as α5β1, are shown using an ellipsoid or torus for each extracellular domain. The extended‐closed structure is made by rigid body movements at the knees. The extended‐open structure is derived from extended‐closed by superposition on the open headpiece of αIIbβ3 (Xiao et al, 2004). (B) Identical to (A, lower) except molecular surfaces are shown for N‐glycans removed by mutation (Fig 6D–F, white) or not removed (blue). Glycans have the structure shown in (E). Glycans were added at all α5β1 N‐glycosylation sequons using α5β1 headpiece structures (Xia & Springer, 2014) and an αVβ3 homology model. (C) Equations that describe the affinities and conformational equilibria of integrin ensembles.
- D
Representative cytokine or growth factor receptor. The ligand‐bound dimer is compact similarly to the bent‐closed integrin conformation, whereas the unassociated monomers show no interaction with one another and thus separate from one another similarly to leg domains in the extended‐open integrin structure. Therefore, inter‐subunit crowding interactions may regulate ligand binding and dimerization in such receptors analogously to regulation of conformational transitions in integrins. Individual domains are shown as ellipses, and N‐glycans are shown as blue molecular surfaces using the same chemical structures as in (B).
- E
Representative N‐glycan structures. The complex glycan is common among α5β1 N‐glycans (Sieber et al, 2007) and contains the average number of monosaccharide residues per N‐glycosylation sequon found here for the complex glycoform of α5β1. The high‐mannose glycan contains the average number of monosaccharide residues in the high‐mannose form of α5β1. The shaved glycan is that after Endo H digestion; the mass estimated here for shaved α5β1 suggests part of high‐mannose glycans are shaved and the remainder are resistant to Endo H.
- A
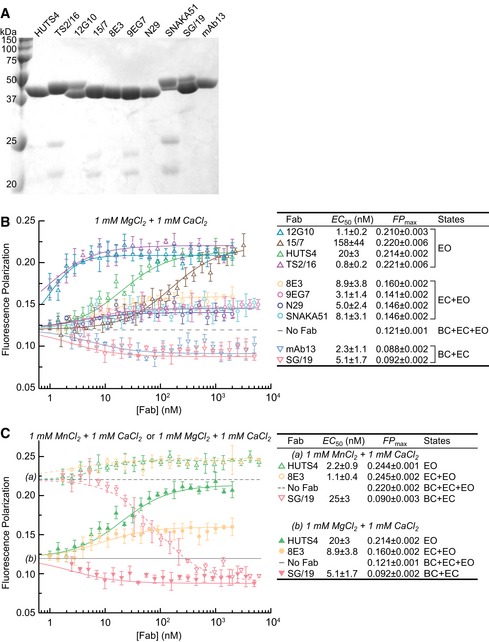
Coomassie‐stained, non‐reducing SDS 12.5% PAGE of Fabs.
- B, C
Dependence of unclasped, high‐mannose α5β1 ectodomain (20 nM) binding to FITC‐cRGD (5 nM) in FP assays on Fab concentration in 1 mM Mg2+ & 1 mM Ca2+ (B) and in 1 mM Mg2+ & 1 mM Ca2+ compared to 1 mM Mn2+ & 1 mM Ca2+ (C). Values to the right of each plot are from nonlinear least square fits to Appendix Equation S1 (mean ± s.d. of triplicates).
- A, B
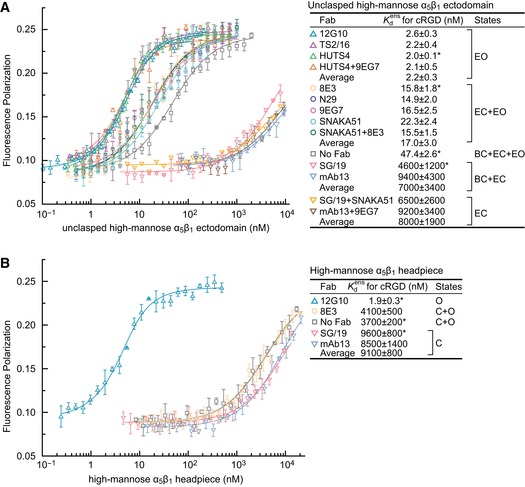
Affinities of high‐mannose glycoforms of the unclasped α5β1 ectodomain (A) and headpiece (B) were measured using FP with FITC‐cRGD in the presence of the indicated Fabs. Errors in the plotted datapoints are s.d. from average value of triplicate measurements. Errors for affinities in the inset table are s.d. from nonlinear least square fits of the average values from the triplicate measurements except values with “*” are s.d. from three experiments on different days.
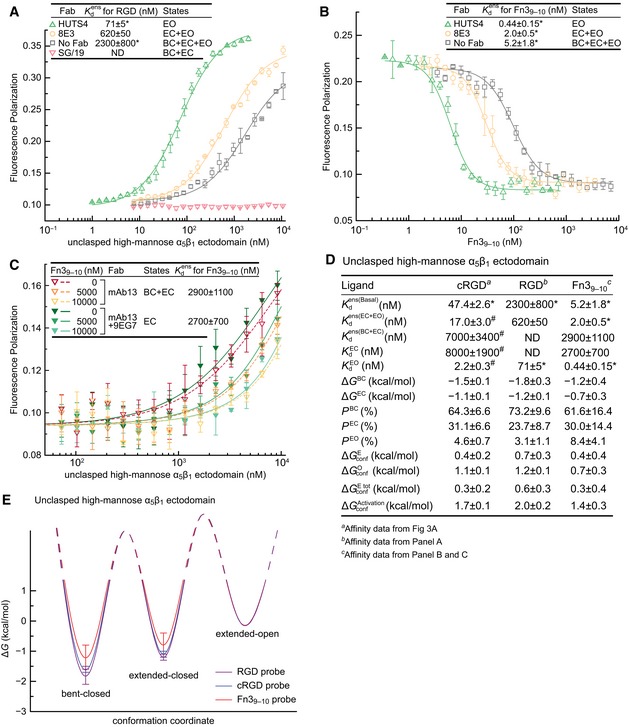
Affinity for FITC‐RGD measured with FP.
Affinity for Fn39–10 measured by inhibition of FITC‐cRGD binding to 20 nM α5β1 (with open‐stabilizing Fab), 90 nM α5β1 (with extension‐stabilizing Fab), or 270 nM α5β1 (with no Fab).
Affinity for Fn39–10 measured by inhibition of FITC‐cRGD binding to a range of α5β1 concentrations (with closure‐stabilizing Fab) at three Fn39–10 concentrations.
Tabulation of results.
Energy landscape plots showing valleys for the ΔG values determined here as lines, and hills for the transition state ΔG values, which remain to be determined, as dashed lines.
- A
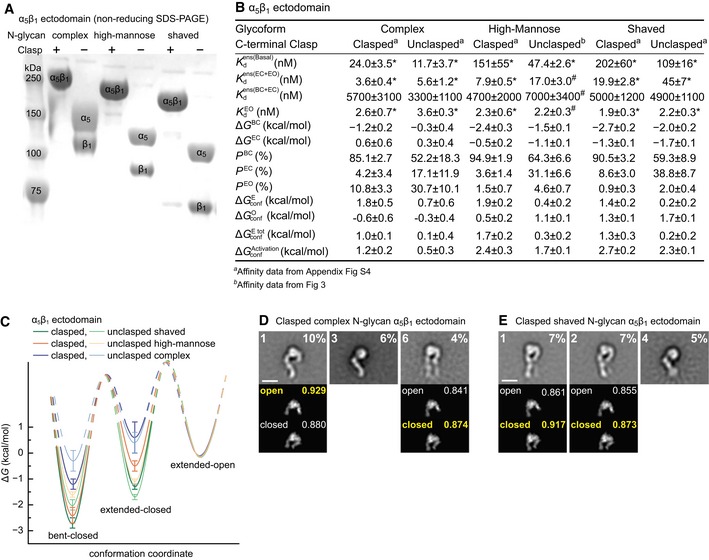
SDS 7.5% PAGE of three α5β1 ectodomain glycoforms with or without C‐terminal clasp stained with Coomassie blue.
- B, C
Tabulation of results (B) and energy landscape plots (C). See Appendix Fig S4 for representative FP results. Error definitions and explanations of values marked with “*” and “#” are as in the Fig 4 legend.
- D, E
Effect of complex (D) and shaved (E) N‐glycans on clasped α5β1 ectodomain conformation in EM. Representative, well‐resolved class averages are shown together with their rank among 35 class averages and the % of total particles in that class (inset, upper left and right, respectively). Below each en face class average are the best cross‐correlating projections of open and closed headpiece crystal structures to the headpiece portion of the EM class average. Insets show correlation coefficients with the best correlating conformation in yellow. Scale bars are 10 nm. All class averages are shown in Appendix Fig S6.
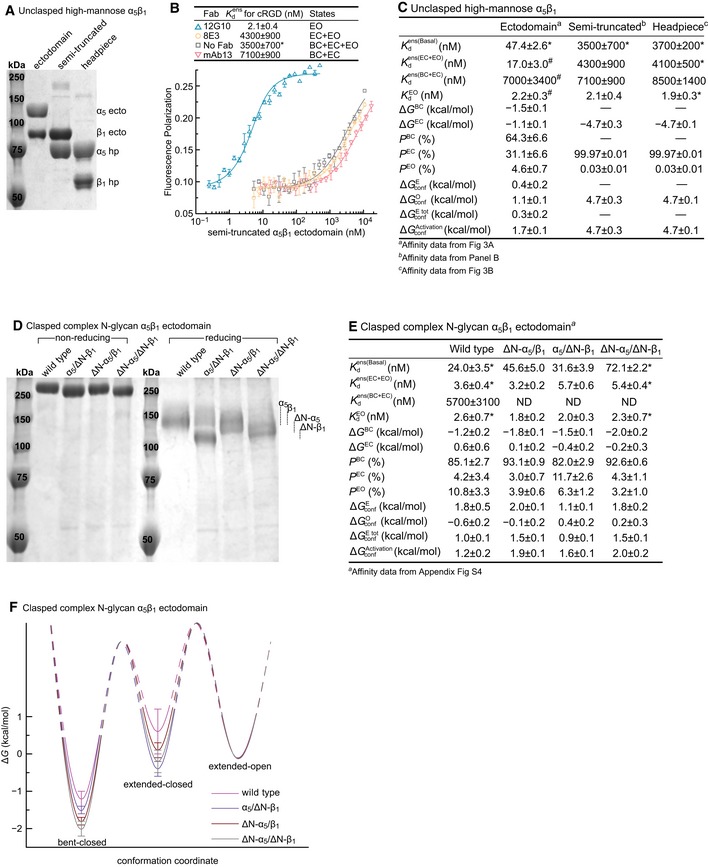
- A–C
The semi‐truncated α5β1 ectodomain. (A) Coomassie‐stained SDS 7.5% PAGE. (B) Affinity of FITC‐cRGD for the semi‐truncated, high‐mannose α5β1 ectodomain in the presence of the indicated Fabs measured with FP. (C) Comparison of the semi‐truncated ectodomain to the unclasped α5β1 ectodomain and headpiece, all with high‐mannose glycans.
- D–F
Effect of N‐glycosylation sequon mutation. The ΔN‐α5 and ΔN‐β1 mutants have 6 of 14 and 5 of 12 predicted N‐glycosylation sites mutated, respectively. The indicated mutants were tested in the clasped α5β1 ectodomain with complex N‐glycosylation. (D) Coomassie‐stained SDS 7.5% PAGE. (E) Tabulation of results. See Appendix Fig S4 for representative FP results. ND, not determined; limited solubility of the N‐glycosylation sequon mutants prevented their use at the high concentrations required for intrinsic affinity measurements of the BC+EC ensemble. Therefore, thermodynamic parameters were calculated by assuming that the intrinsic affinities of the BC and EC conformations were identical to those determined for the WT ectodomain. (F) Energy landscape plots are as described in the Fig 4E legend.
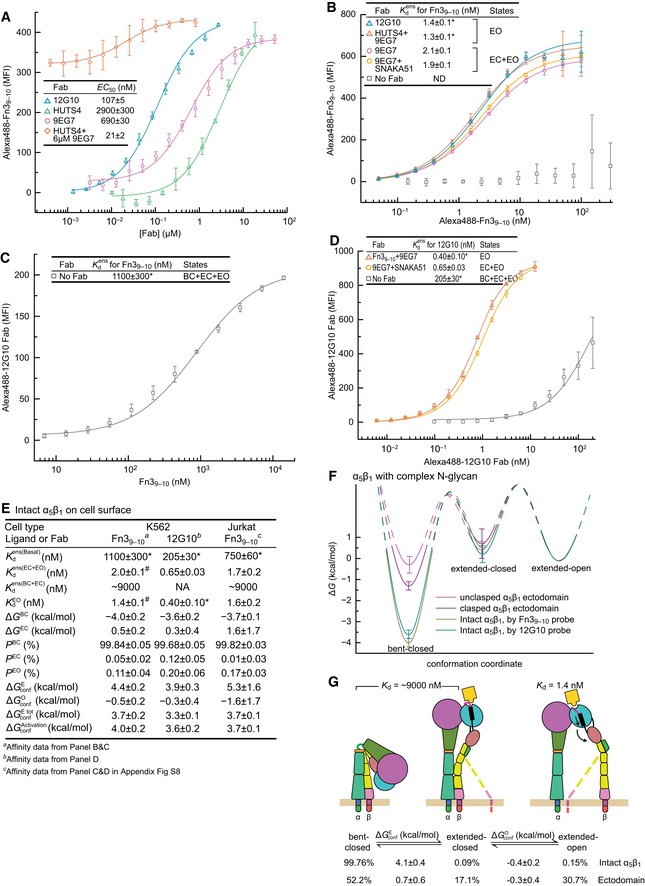
Determination of EC50 values for conformation‐selective Fabs from enhancement of 10 nM Alexa488‐Fn39–10 binding and fitting to Appendix Equation S2. Mean ± s.d. of least square fits to triplicates.
Affinity of α5β1 for Alexa488‐Fn39–10 in the presence of indicated Fabs.
Affinity of α5β1 for Fn39–10 by enhancement of 0.4 nM Alexa488‐12G10 Fab binding.
Affinities of α5β1 for Alexa488‐12G10 Fab in the presence of indicated Fabs.
Thermodynamics and intrinsic affinities of α5β1 conformational states on K562 cells and Jurkat cells (Appendix Fig S8). Affinity for Fn39–10 of the closed conformations of α5β1 on K562 cells was estimated from using the same fold‐difference as found with Fn39–10 for the α5β1 ectodomain (Fig 4D). Since 12G10 stabilizes the open conformation only, thermodynamic calculations use K a = 0 for the closed conformations.
Energy landscape plots, as described in the Fig 4E legend, comparing K562 α5β1 to the clasped and unclasped α5β1 ectodomain with complex glycosylation (Fig 5B).
Summary of the intrinsic affinities of α5β1 conformational states on K562 cells and comparison of the conformational equilibria for α5β1 on K562 cells and for the unclasped α5β1 ectodomain with complex glycosylation.
References
-
- Bazzoni G, Ma L, Blue M‐L, Hemler ME (1998) Divalent cations and ligands induce conformational changes that are highly divergent among β1 integrins. J Biol Chem 273: 6670–6678 - PubMed
-
- Bouvard D, Pouwels J, De Franceschi N, Ivaska J (2013) Integrin inactivators: balancing cellular functions in vitro and in vivo. Nat Rev Mol Cell Biol 14: 430–442 - PubMed
Publication types
MeSH terms
Substances
Grants and funding
LinkOut - more resources
Full Text Sources
Other Literature Sources
Research Materials
