. 2017 Mar 10;7(3):967-981.
doi: 10.1534/g3.116.038125.

The Impact of Selection at the Amino Acid Level on the Usage of Synonymous Codons

Affiliations

The Impact of Selection at the Amino Acid Level on the Usage of Synonymous Codons

Paweł Błażej et al. G3 (Bethesda). .

Abstract

There are two main forces that affect usage of synonymous codons: directional mutational pressure and selection. The effectiveness of protein translation is usually considered as the main selectional factor. However, biased codon usage can also be a byproduct of a general selection at the amino acid level interacting with nucleotide replacements. To evaluate the validity and strength of such an effect, we superimposed >3.5 billion unrestricted mutational processes on the selection of nonsynonymous substitutions based on the differences in physicochemical properties of the coded amino acids. Using a modified evolutionary optimization algorithm, we determined the conditions in which the effect on the relative codon usage is maximized. We found that the effect is enhanced by mutational processes generating more adenine and thymine than guanine and cytosine, as well as more purines than pyrimidines. Interestingly, this effect is observed only under an unrestricted model of nucleotide substitution, and disappears when the mutational process is time-reversible. Comparison of the simulation results with data for real protein coding sequences indicates that the impact of selection at the amino acid level on synonymous codon usage cannot be neglected. Furthermore, it can considerably interfere, especially in AT-rich genomes, with other selections on codon usage, e.g., translational efficiency. It may also lead to difficulties in the recognition of other effects influencing codon bias, and an overestimation of protein coding sequences whose codon usage is subjected to adaptational selection.

Keywords: amino acid; codon usage; mutation; selection; synonymous codons.


Figures

Figure 1
Figure 1
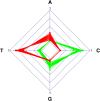
Comparison of two sets of 100 stationary distributions for which Fπmax (the normalized difference between the relative frequency of 4FD codons after selection on amino acids, and their expected frequency resulting only from a mutation process) takes the highest (red) and the lowest values (green). The Fπmax is the highest for the distributions with the high frequency of thymine and adenine, respectively, whereas the lowest for the distributions rich in cytosine and guanine, respectively.
Figure 2
Figure 2
Relationship between the Fπmax value and combination of two nucleotides presented as colored Wafer maps. The colors correspond to the value of Fπmax, which depends on the frequency of the compared nucleotides. Dark green corresponds the lowest values, and dark brown the highest values of Fπmax. Its highest values are for the high content of thymine and adenine, with simultaneous decrease in the guanine and cytosine frequency. The lowest values are for the low frequency of A and T, as well as for moderate content of G and C.
Figure 3
Figure 3
Dependence of median value of Fπmax, i.e., me(Fπmax) on stationary frequencies of four nucleotides π. The median was calculated from Fπmax values that were derived from substitution models generating nucleotide stationary distributions, with the given fixed frequency of one nucleotide πi and random frequencies of others. The dots represent exact values of me(Fπmax), whereas lines are the best approximation based on generalized additive models with integrated smoothness estimation. The me(Fπmax) depends nonlinearly on the stationary distribution of particular nucleotides. Its strongest increase is for the growth of A and T.
Figure 4
Figure 4
Dependence of median value of Fπmax, i.e., me(Fπmax) on stationary content of: adenine + thymine (A), guanine + cytosine (B), adenine and thymine (C), and guanine and cytosine (D) with equal frequencies, as well as purines (E) and pyrimidines (F). There is a clear nonlinear relationship with the minimum for equal proportions of purines and pyrimidines.
Figure 5
Figure 5
Dependence of the median value of Fπ|Smax, i.e., me(Fπ|Smax) for 4FD codon groups (assigned by their coded amino acids) on the stationary frequencies of four nucleotides π: adenine (A), thymine (B), guanine (C), and cytosine (D). The dots represent exact values of me(Fπmax), whereas lines are the best approximation based on generalized additive models with integrated smoothness estimation. The median value depends differently on the codon groups and nucleotides.
Figure 6
Figure 6
Dependence of the median value of Fπ|Smax, i.e., me(Fπ|Smax) for 4FD codon groups (assigned by their coded amino acids) on the stationary frequencies of purines (A) and pyrimidines (B). The dots represent exact values of me(Fπmax), whereas lines are the best approximation based on generalized additive models with integrated smoothness estimation. The groups of codons response differently to the frequencies.
Figure 7
Figure 7
Distribution of the deviation from the expectation in the codon usage for all 4FD groups calculated for protein coding sequences, starting (randomly selected) nucleotide substitution matrices, and matrices that maximized this measure. The maximized values are of the same order of magnitude as the deviation based on empirical data.
Figure 8
Figure 8
Dependence on the genomic A+T content of the difference in the relative usage of 4FD codons between genes coding for ribosomal and nonribosomal proteins. The difference was calculated based on 4802 genomes, with at least 30 genes annotated for ribosomal proteins, separately for the leading and lagging strand. In total, 5124 pairs of genes, with at least 15 ribosomal genes on one strand, were considered. The bars represent an average value for the given class of A+T content, whereas whiskers represent SD. The difference was calculated according to: sSiA,T,G,C|osirib/osribosinonrib/osnonrib|, where osiis the observed frequency of a 4FD codon si with a nucleotide i at the third codon position, and os=iA,T,G,Cosi is the frequency of all codons in the 4FD codon group S. Indices rib and nonrib mean genes for ribosomal and nonribosomal proteins, respectively. The calculated difference decreases with AT%, and is the largest for the moderate AT content.

Similar articles

Cited by

References

    1. Akashi H., 1994. Synonymous codon usage in Drosophila-melanogaster—natural-selection and translational accuracy. Genetics 136: 927–935. - PMC - PubMed
    1. Akashi H., 2003. Translational selection and yeast proteome evolution. Genetics 164: 1291–1303. - PMC - PubMed
    1. Banerjee T., Basak S., Gupta S. K., Ghosh T. C., 2004. Evolutionary forces in shaping the codon and amino acid usages in Blochmannia floridanus. J. Biomol. Struct. Dyn. 22: 13–23. - PubMed
    1. Bartoszewski R. A., Jablonsky M., Bartoszewska S., Stevenson L., Dai Q., et al. , 2010. A synonymous single nucleotide polymorphism in DeltaF508 CFTR alters the secondary structure of the mRNA and the expression of the mutant protein. J. Biol. Chem. 285: 28741–28748. - PMC - PubMed
    1. Bazykin G. A., 2015. Changing preferences: deformation of single position amino acid fitness landscapes and evolution of proteins. Biol. Lett. 11: 20150315. - PMC - PubMed

Publication types

LinkOut - more resources