. 2017 Apr 1;117(4):1581-1594.
doi: 10.1152/jn.00295.2016. Epub 2017 Jan 25.

Spontaneous dynamics of neural networks in deep layers of prefrontal cortex

Affiliations

Spontaneous dynamics of neural networks in deep layers of prefrontal cortex

Andrew S Blaeser et al. J Neurophysiol. .

Abstract

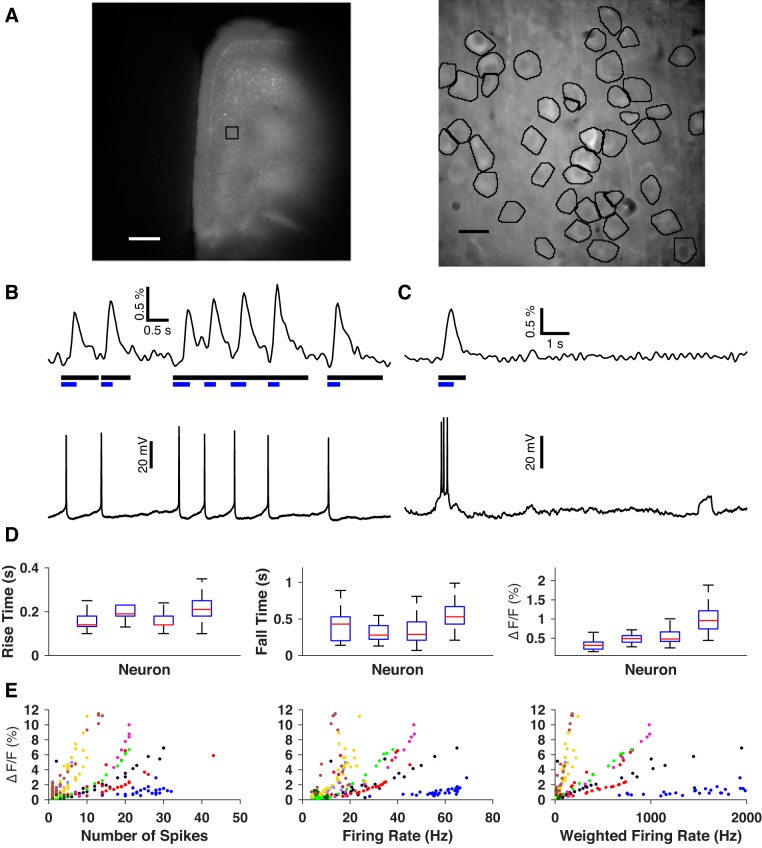
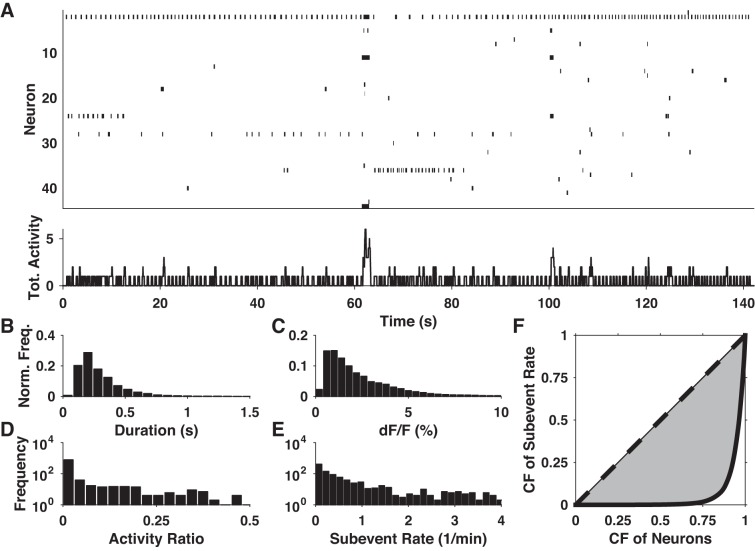
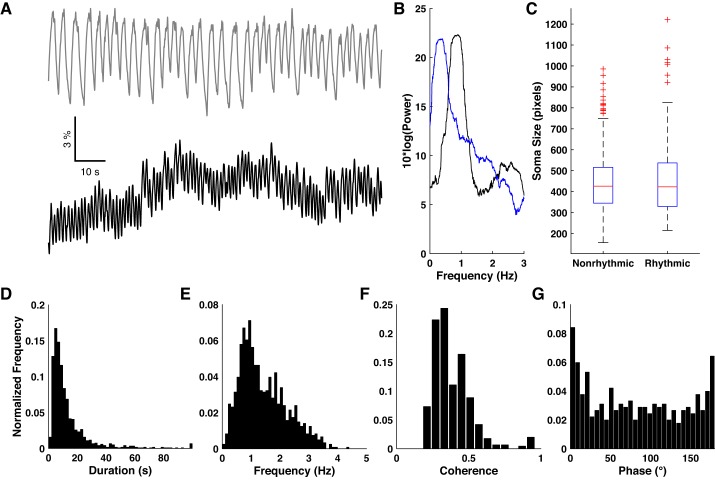
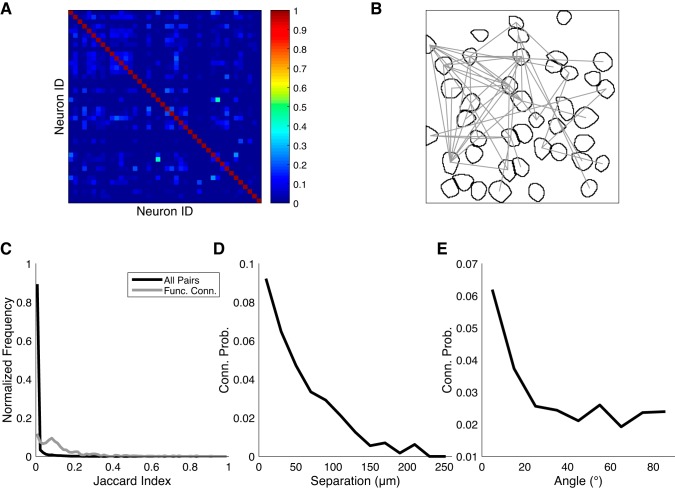
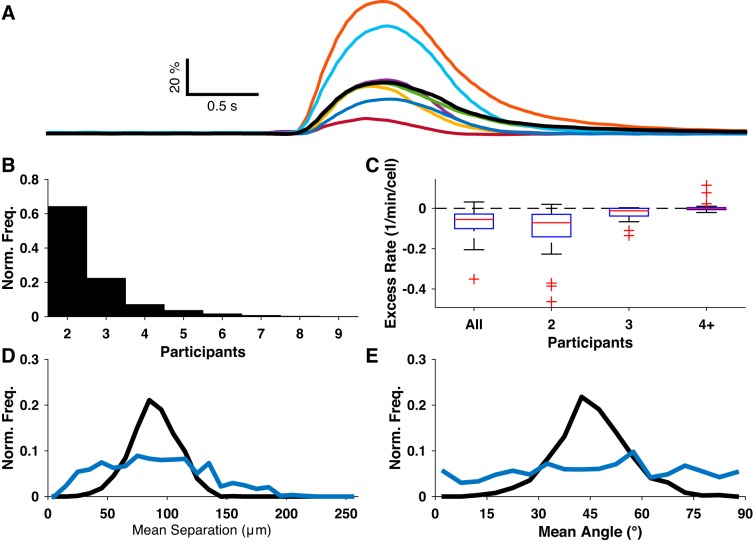
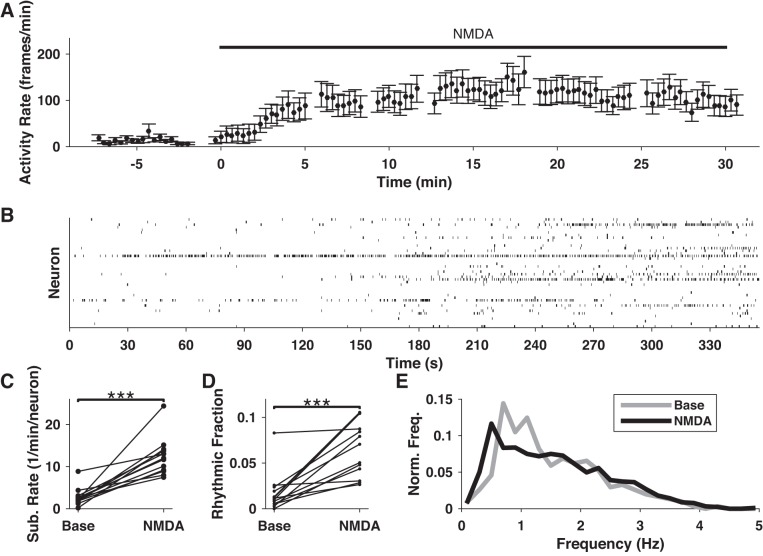
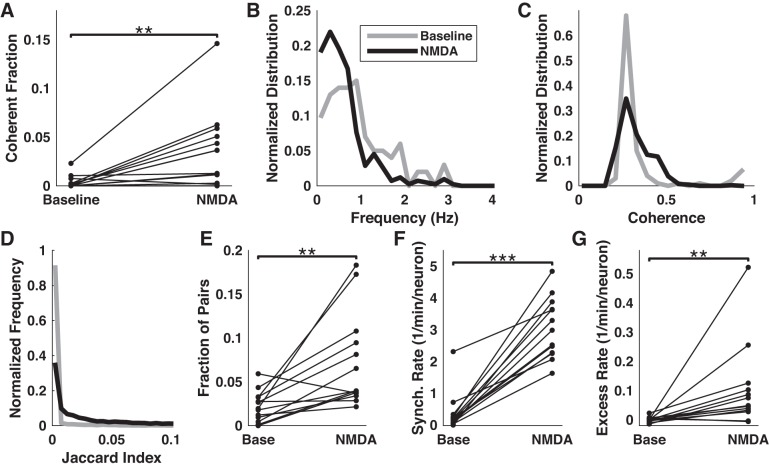
Cortical systems maintain and process information through the sustained activation of recurrent local networks of neurons. Layer 5 is known to have a major role in generating the recurrent activation associated with these functions, but relatively little is known about its intrinsic dynamics at the mesoscopic level of large numbers of neighboring neurons. Using calcium imaging, we measured the spontaneous activity of networks of deep-layer medial prefrontal cortical neurons in an acute slice model. Inferring the simultaneous activity of tens of neighboring neurons, we found that while the majority showed only sporadic activity, a subset of neurons engaged in sustained delta frequency rhythmic activity. Spontaneous activity under baseline conditions was weakly correlated between pairs of neurons, and rhythmic neurons showed little coherence in their oscillations. However, we consistently observed brief bouts of highly synchronous activity that must be attributed to network activity. NMDA-mediated stimulation enhanced rhythmicity, synchrony, and correlation within these local networks. These results characterize spontaneous prefrontal activity at a previously unexplored spatiotemporal scale and suggest that medial prefrontal cortex can act as an intrinsic generator of delta oscillations.NEW & NOTEWORTHY Using calcium imaging and a novel analytic framework, we characterized the spontaneous and NMDA-evoked activity of layer 5 prefrontal cortex at a largely unexplored spatiotemporal scale. Our results suggest that the mPFC microcircuitry is capable of intrinsically generating delta oscillations and sustaining synchronized network activity that is potentially relevant for understanding its contribution to cognitive processes.

Keywords: calcium imaging; delta oscillations; prefrontal cortex; synchrony.


Figures

Fig. 1.
Fig. 1.
Expression and characterization of GCaMP6f in mPFC neurons. A: GCaMP6f fluorescence in mPFC imaged at low (left) and high (right) magnification. The black square on the low-magnification image indicates the approximate area imaged at high magnification. The high-magnification image is a mean projection of one movie. Black outlines indicate final regions of interest around neuronal somata. Scale bars: 0.5 mm, 10 μm, respectively. B and C: representative examples of the correspondence between neuronal firing and GCaMP6f fluorescence response. Black bars signify the durations of detected events. Blue bars represent durations of subevents detected within these events. B: subevents generated from single action potentials. C: a different neuron’s fluorescence response to a spike train and non-response to a subthreshold depolarization. D: neuron-to-neuron comparisons of GCaMP6f response to single action potentials in terms of rising time constant (left), falling time constant (middle) and relative magnitude (right). E: calibration of relative magnitude of fluorescence response to spike trains as a function of number of spikes (left), mean firing rate (middle) and spike-weighted firing rate (right). Each marker’s color/shape combination identifies a distinct neuron.
Fig. 2.
Fig. 2.
Basic properties of spontaneous activity. A: panel at top shows an example raster plot of spontaneous activity: each row represents a neuron, and black dashes signify subevents. Panel at bottom shows total (sum) activity of all neurons shown in the panel at top. B and C: normalized histograms of subevent duration and relative magnitude pooled from all data sets. D and E: histograms of activity ratio and subevent rate of all analyzed neurons. F: Lorenz curves of subevent rate observed across all neurons (solid black curve) and for a perfectly uniform distribution (dashed line). The shaded area between these curves is used to calculate the Gini coefficient. CF, cumulative fraction.
Fig. 3.
Fig. 3.
Spontaneous rhythmic activity. A: representative example of two neurons showing highly rhythmic activity in baseline ACSF. B: Fourier power spectra of the binarized traces derived from the two traces in A. C: comparison of soma size between nonrhythmic and rhythmic cells. D and E: normalized histograms of basic properties of rhythmic epochs under baseline conditions. F and G: normalized histograms of coherence magnitude and phase angle for all pairs of neurons exhibiting statistically significant coherence.
Fig. 4.
Fig. 4.
Pairwise correlation of spontaneously active neurons. A: example Jaccard similarity matrix obtained from one slice in baseline ACSF. B: example map of functional connections (gray lines) between neurons in the same data set as A. C: distributions of Jaccard indices under baseline conditions, pooling all pairs (black curve), or functionally connected pairs (gray) of active neurons from all slices. D and E: conditional probability of functional connection, as a function of neuronal separation distance and the angle between the line segment connecting the pair of neurons and the medial-lateral axis.
Fig. 5.
Fig. 5.
Spontaneous synchrony. A: fluorescence traces from eight neurons identified as participants in a synchronous event. B: distribution of number of neuronal participants for all synchronous events. C: excess rate of synchronous events, binned by number of participants. D and E: distributions of mean separation and mean angle of participant subevents/neurons for low-synchrony (blue) and high-synchrony (black) synchronous events.
Fig. 6.
Fig. 6.
Effects of NMDA on spontaneous neuronal activity. A: representative example of the activity rate (total subevent frames per neuron per 30-s bin) in response to wash-in of NMDA. B: example raster plot showing the effect of NMDA on rhythmic activity. Activity increases roughly 3 min after beginning of wash-in (180 s). Rhythmic activity in particular increases under NMDA stimulation, as evidenced by the appearance of several neurons showing repetitive activations of self-similar duration and frequency. C: comparison of overall subevent rates before and after NMDA application for all NMDA data sets. D: the fraction of neurons exhibiting rhythmic activity increases under NMDA stimulation. E: frequency spectra of rhythmic epochs under baseline (gray) and NMDA (black) conditions. ***P < 0.001.
Fig. 7.
Fig. 7.
Effects of NMDA on network activity. A Comparison of the fraction of pairs of neurons showing statistically significant coherence before and during application of NMDA. B and C: distributions of frequencies of peak coherence and magnitude of coherence before and during NMDA stimulation. D: normalized histograms of Jaccard indices pooled from all pairs of neurons under baseline (gray) or NMDA (black) condition. E: fraction of pairs of neurons that were identified as functionally connected under each condition. F: the overall rate of synchronous events increased during NMDA application. G: excess rate of 4+ neuron-synchronous events (relative to upper 99% confidence interval) increased during NMDA application. **P < 0.01 and ***P < 0.001.

References

    1. Alper KR, John ER, Brodie J, Günther W, Daruwala R, Prichep LS. Correlation of PET and qEEG in normal subjects. Psychiatry Res 146: 271–282, 2006. doi:10.1016/j.pscychresns.2005.06.008. - DOI - PubMed
    1. Amzica F, Steriade M. Electrophysiological correlates of sleep delta waves. Electroencephalogr Clin Neurophysiol 107: 69–83, 1998. doi:10.1016/S0013-4694(98)00051-0. - DOI - PubMed
    1. Barth AL, Poulet JFA. Experimental evidence for sparse firing in the neocortex. Trends Neurosci 35: 345–355, 2012. doi:10.1016/j.tins.2012.03.008. - DOI - PubMed
    1. Beltramo R, D’Urso G, Dal Maschio M, Farisello P, Bovetti S, Clovis Y, Lassi G, Tucci V, De Pietri Tonelli D, Fellin T. Layer-specific excitatory circuits differentially control recurrent network dynamics in the neocortex. Nat Neurosci 16: 227–234, 2013. doi:10.1038/nn.3306. - DOI - PubMed
    1. Benchenane K, Tiesinga PH, Battaglia FP. Oscillations in the prefrontal cortex: a gateway to memory and attention. Curr Opin Neurobiol 21: 475–485, 2011. doi:10.1016/j.conb.2011.01.004. - DOI - PubMed

Publication types

MeSH terms

LinkOut - more resources