. 2017 Jan 25;37(4):854-870.
doi: 10.1523/JNEUROSCI.1789-16.2016.

Differential Encoding of Time by Prefrontal and Striatal Network Dynamics

Affiliations

Differential Encoding of Time by Prefrontal and Striatal Network Dynamics

Konstantin I Bakhurin et al. J Neurosci. .

Abstract

Telling time is fundamental to many forms of learning and behavior, including the anticipation of rewarding events. Although the neural mechanisms underlying timing remain unknown, computational models have proposed that the brain represents time in the dynamics of neural networks. Consistent with this hypothesis, changing patterns of neural activity dynamically in a number of brain areas-including the striatum and cortex-has been shown to encode elapsed time. To date, however, no studies have explicitly quantified and contrasted how well different areas encode time by recording large numbers of units simultaneously from more than one area. Here, we performed large-scale extracellular recordings in the striatum and orbitofrontal cortex of mice that learned the temporal relationship between a stimulus and a reward and reported their response with anticipatory licking. We used a machine-learning algorithm to quantify how well populations of neurons encoded elapsed time from stimulus onset. Both the striatal and cortical networks encoded time, but the striatal network outperformed the orbitofrontal cortex, a finding replicated both in simultaneously and nonsimultaneously recorded corticostriatal datasets. The striatal network was also more reliable in predicting when the animals would lick up to ∼1 s before the actual lick occurred. Our results are consistent with the hypothesis that temporal information is encoded in a widely distributed manner throughout multiple brain areas, but that the striatum may have a privileged role in timing because it has a more accurate "clock" as it integrates information across multiple cortical areas.

Significance statement: The neural representation of time is thought to be distributed across multiple functionally specialized brain structures, including the striatum and cortex. However, until now, the neural code for time has not been compared quantitatively between these areas. Here, we performed large-scale recordings in the striatum and orbitofrontal cortex of mice trained on a stimulus-reward association task involving a delay period and used a machine-learning algorithm to quantify how well populations of simultaneously recorded neurons encoded elapsed time from stimulus onset. We found that, although both areas encoded time, the striatum consistently outperformed the orbitofrontal cortex. These results suggest that the striatum may refine the code for time by integrating information from multiple inputs.

Keywords: decoding; machine-learning algorithm; neural dynamics; orbitofrontal cortex; striatum; time coding.


Figures

Figure 1.
Figure 1.
Large-scale recording of OFC and striatal networks during reward-predictive behavior. A, Task schema. Mice received pseudorandomly ordered presentations of a CS+ odor that predicted reward delivery 2.5 s after odor onset and an unrewarded CS odor. Rectangles represent odor-on time. Red triangle and vertical blue dashed line indicate reward delivery. B, Example of anticipatory licking behavior of one mouse during CS+ trials. Shaded blue rectangle represents odor presentation time. Black tick marks indicate individual licks and red ticks denote lick onset times that are used for subsequent analysis. Trials are sorted by descending latency to first lick. C, Cumulative distributions of lick onset times during CS+ trials for all mice included in the study (n = 11 mice). D, Distribution of the trough-to-peak width (milliseconds) recorded from striatal units (top) and OFC units (bottom). Vertical dotted lines depict the threshold margin (0.475 to 0.55 ms) for segregating putative FSIs (red histograms) from putative principal cells (striatal MSNs and OFC pyramidal cells, blue histograms). Gray bars reflect unclassified cells. E, Individual population-level recordings from the striatum (top) and the prefrontal cortex (bottom) during correctly performed CS+ trials. Each row in a matrix represents the mean normalized firing rate of one recorded putative projection neuron in the corresponding brain area. Units are sorted by their latency to maximum firing rate. Blue rectangles indicate CS+ odor presentation time and red triangles mark the time of reward delivery.
Figure 2.
Figure 2.
Schematic of the SVM decoding of elapsed time. A, Training the SVM. Single-trial spiking activity of each unit in a simultaneously recorded population (only 3 units represented) is transformed into a firing rate estimate for the unit during the 2.5 s interval after odor presentation onset (data not shown here). The rate estimates are binned (100 ms time bins) to construct 25 population activity patterns per trial. Using a one-against-one multiclass strategy, the SVM trains a set of binary classifiers to distinguish the population activity pattern in each time bin from every other time bin. SVM output is conceptualized as 25 readout units, one per target time bin, that learn to distinguish activity patterns in their respective target time bin from those in all other bins. B, The model is tested using a Monte Carlo cross-validation approach in which each activity pattern from novel trials (i.e., those excluded from the training set) is tested on trained SVM models. Illustrated is the testing of bin #2 of the test trial. C, Readout units score each test activity pattern for how closely it corresponds to their respective target bins. The target time bin of the readout with the maximal value is chosen as the predicted time in a winners-take-all manner (marked with a red vertical line). Actual readout values are depicted here.
Figure 3.
Figure 3.
Striatal networks encode elapsed time. A, Cross-temporal classification matrices visualizing SVM model performance on striatal network data recorded during individual correctly performed CS+ trials. Each column represents the normalized readout values normalized across SVM readout units for the activity pattern from the corresponding correct time bin (x-axis). Peaks in each column reflect the predicted time chosen by the model. The black dotted line lies along the diagonal. B, Top, Average of classification matrices generated across all correct CS+ trials for one striatal recording. Center, Average classification matrix across all correct CS+ trials after bin shuffling each unit's activity in the same recording. Bottom, Average classification matrix across all correct CS+ trials after trial shuffling each unit's activity in the same recording. C, Scatter plot of predicted versus correct time bins across 80 correctly performed CS+ trials for one striatal recording. Predicted bin numbers (y-axis) were jittered (Gaussian noise, mean = 0, SD = 0.2) to separate overlapping points. The blue solid line represents the regressed line describing the correlation between actual and predicted time. The red dotted line lies along the identity line. D, Mean correlation coefficients between predicted and correct time bins across all striatal recordings (55 units per animal, n = 9) for observed, bin-shuffled, and trial-shuffled data types. SVM classification of population activity was repeated 30 times (see Materials and Methods). SVM models trained on trial-shuffled activity performed better than when trained on observed (nonshuffled) activity patterns (p = 0.023, paired t test). Bin-shuffled models performed at chance level significantly worse than nonshuffled models (p < 0.0001, paired t test). E, Comparison of SVM performance using nonshuffled and trial-shuffled network activity as a function of the number of units used for training and testing. There was a significant effect of data type (F(1,8) = 7.9, p = 0.023) and number of units (F(6,48) = 109.7, p < 0.0001, two-way repeated-measures ANOVA). F, Bin-shuffled models performed worse than nonshuffled models for each population size used in the model (F(1,8) = 178.0, p < 0.0001, two-way repeated-measures ANOVA). Error bars indicate SEM.
Figure 4.
Figure 4.
Striatal networks encode elapsed time better than OFC networks. A, Average cross-temporal classification matrix across all correct CS+ trials for one OFC recording. Color scale is the same as in Figure 3B. B, Mean correlation coefficients across all OFC recordings (55 units per animal, n = 6) for observed, bin-shuffled and trial-shuffled data types. SVM classification of population activity was repeated 30 times (see Materials and Methods). SVM models trained on trial-shuffled activity were not significantly different from those trained on nonshuffled activity patterns (p = 0.21, paired t test). Bin-shuffled models performed at chance level and significantly worse than the nonshuffled models (p < 0.0001, paired t test). C, Comparison of SVM performance using nonshuffled and trial-shuffled network activity as a function of the number of units. There was no significant effect of data type (F(1,5) = 2.4, p = 0.18), but we observed a significant effect of the number of units (F(6,30) = 49.6, p < 0.0001, two-way repeated-measures ANOVA). D, Bin-shuffled models performed worse than nonshuffled models for each population size used in the model (F(1,5) = 109.5, p = 0.0001, two-way repeated-measures ANOVA). E, Comparison of SVM model performance between all striatal and OFC recordings (55 units per region, n = 9 striatal recordings and 6 OFC recordings) showed that the classification performance of models trained on striatal network data was significantly better (p = 0.0092, unpaired t test). F, Mean performance of SVM classification as a function of number of units used in training and testing for each brain region. A mixed-model ANOVA revealed a significant effect of number of units (F(5,65) = 191.9, p < 0.0001) and a significant effect of brain region (F(1,13) = 9.0, p = 0.01). The ANOVA excluded the “all units” column because it contained inconsistent numbers of cells between regions. Error bars indicate SEM.
Figure 5.
Figure 5.
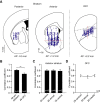
Population encoding of elapsed time is distributed throughout striatum and OFC. A, Illustrations of recording positions of all principal units included in analysis from posterior striatum (left), anterior striatum (center), and OFC (right). Dotted red lines indicate boundaries used to separate units recorded in dorsal and ventral striatum (center) or those recorded in lateral and medial OFC (right). Scale bar, 1 mm. AP positions are distance from bregma. Section diagrams were adapted from Franklin and Paxinos (2008). B, Comparison of elapsed time decoding performance between models trained on recordings from OFC and anterior striatal neurons showed that anterior striatum performs better than OFC (p = 0.0083, unpaired t test). C, Recordings in the anterior striatum were grouped based on whether they included predominantly dorsal or ventrally recorded neurons (n ≥ 35 cells), with one recording being distributed into both subregions. Dorsal and ventral populations performed as well as populations containing 35 cells drawn uniformly at random from both areas (F(2,16) = 0.02, p = 0.98, one-way ANOVA). D, All recordings in the OFC were bisected into lateral and medial populations. Lateral and medial populations performed and populations containing 29 cells drawn uniformly at random from both areas (F(2,10) = 0.48, p = 0.64, one-way repeated-measures ANOVA). Error bars indicate SEM.
Figure 6.
Figure 6.
Population coding of elapsed time is specific to CS+ trials and is not fully explained by licking behavior. A, Mice showed similar licking onset times during CS+ trials and CS false alarm trials (p = 0.80, paired t test). B, Comparison of performance in decoding elapsed time for SVM models trained on correct CS+ trials and tested on either correct CS+ trials or on CS false alarm trials (55 units per region, n = 9 striatal recordings and 6 OFC recordings). There was a significant effect of trial type (F(1,13) = 33.0, p < 0.0001, two-way, mixed-model ANOVA) and a significant effect of brain region (F(1,13) = 18.3, p = 0.00091), with no significant interaction (F(1,13) = 0.5, p = 0.48). C, Mean fraction of recorded principal cell populations showing significant activity modulation by licking in each brain region (p = 0.044, unpaired t test). D, Example licking-modulated principal cells recorded in each region (left, striatal MSN; right, OFC pyramidal). Shaded blue rectangle represents odor presentation time. Black tick marks indicate individual spikes, red ticks denote lick onset times, and blue dotted line shows reward delivery time. Trials are sorted by descending latency to first lick. E, Comparison of elapsed time decoding performance between models generated using all cells or all non-lick-modulated cells. Performance showed a significant decrease with the exclusion of lick-modulated cells (F(1,13) = 17.2, p = 0.0011, two-way, mixed-model ANOVA). The striatum maintained an improved code for time over the OFC after excluding lick-modulated cells (F(1,13) = 7.4, p = 0.017). We did not observe a significant interaction between region and population (F(1,13) = 0.9, p = 0.35). Error bars indicate SEM.
Figure 7.
Figure 7.
Striatal population coding of elapse time shows higher sensitivity to lick onset variability than OFC. A, Schematic illustrating the division of correct CS+ trials into three sets based on terciles of the lick onset distribution. B, Mean prediction biases of SVM decoders trained to predict elapsed time from striatal population data recorded in first tercile trials (orange) and tested on second and third tercile trials. Green bars show decoder biases when trained on third tercile trials and tested on data from first and second tercile trials. Training on first and third tercile trials and testing on second tercile trials produces opposing biases (p = 0.00034, paired t test), as does training on first tercile trials and testing on third tercile trials compared with training on third tercile trials and testing on first tercile trials (p = 0.002, paired t test). C, Mean prediction biases of SVM decoders trained to predict elapsed time from OFC data under similar conditions as in B. No significant difference in biases were observed when training on first and third tercile trials and testing on second tercile trials (p = 0.22, paired t test) or when training on first tercile trials and testing on third tercile trials compared with training on third tercile trials and testing on first tercile trials (p = 0.06, paired t test). D, Illustration of temporal alignment procedure on one striatal recording (88 cells). Distance matrix represents the Euclidean distance between all pairs of population activity patterns in the trial-averaged trajectories for the first and third tercile trials. Red line traces the minimum distance path along the distance matrix between the beginning and the end of the mean first tercile trajectory. A deviation (red arrows) of this path from the diagonal (dashed yellow line) measures the temporal warping of the mean third tercile trajectory relative to the mean first tercile trajectory. The upward shift observed here indicates that the mean third tercile trajectory is consistently slower. E, Mean temporal warping of striatal (black) and orbitofrontal (blue) third tercile trajectories relative to their respective first tercile trajectories. Error bars indicate SEM.
Figure 8.
Figure 8.
Striatal networks outperform OFC networks at predicting lick onset time. A, Illustration of lick onset time prediction analysis. Raster plots show the same MSN population's activity during different correct CS+ trials. Top schematic shows odor on time (blue rectangle), reward delivery (red triangle), and actual lick times (red/black lines) that correspond to the recorded raster plots. Each correctly performed CS+ trial has a lick onset time indicated by a red line. As in the elapsed time prediction analysis, in each trial, spiking activity of each unit was transformed into corresponding firing rate estimates (data not shown) and the firing rates of simultaneously recorded units were binned (100 ms time bins) to construct population firing patterns for the trial. In each trial, the bin during which the first lick occurred is labeled as its lick onset bin (violet shading). A binary SVM classifier, represented here by a readout unit, was trained to distinguish between lick onset bins and non-lick onset bins (green shading). B, The model is tested using a Monte Carlo cross-validation approach. Population activity patterns for all time bins in a trial are presented to the classifier, which predicts the lick onset bin for the trial as the time bin with the maximal readout value. C, Heat plot showing normalized trial-averaged readout values generated by the SVM trained and tested on striatal network activity of one mouse. Trials are sorted by decreasing latency to lick onset time, indicated by a red tick mark. D, 2D density plot showing the joint distribution of actual lick onset times and those predicted by the SVM from striatal network activity, for one mouse. Prediction performance is measured as the RMSE. Lick onset bin classification was repeated 30 times for each trial (see Materials and Methods). Actual and predicted lick onset bins were jittered (Gaussian noise with 0 mean, 0.3 SD) to separate overlapping points. E, Comparison of mean predicted lick onset bin RMSEs across all striatal and OFC recordings (55 units per region, n = 9 striatal recordings and 6 OFC recordings) showed that models trained on striatal network data performed significantly better (p = 0.032, unpaired t test). Bin-shuffled models based on striatal recordings performed significantly worse than corresponding nonshuffled models (p < 0.0001, paired t test). Bin-shuffled models based on OFC recordings also performed worse than corresponding nonshuffled models (p = 0.0002, paired t test). Error bars indicate SEM.
Figure 9.
Figure 9.
Simultaneous multiregion recordings indicate that striatum encodes elapsed time better than OFC. A, Left, Average cross-temporal classification matrix showing mean performance of the elapsed time classifier across all correct CS+ trials for one striatal recording that occurred in parallel with a OFC recording in the same mouse. The classification matrix for the corresponding OFC recording is shown at right. B, Mean correlation coefficient across simultaneous striatal and OFC recordings (55 units per region, n = 4) for each brain region. SVM classification of population activity was repeated 30 times (see Materials and Methods). SVM models trained on striatal activity performed better than when trained on OFC activity patterns (p = 0.013, paired t test). C, Performance comparison of SVM models trained and tested on striatal and OFC network activity from simultaneous recordings as a function of number of units. There was a significant effect of brain region (F(1,3) = 58.1, p = 0.0047) and number of units (F(5,15) = 73.4, p < 0.0001, two-way repeated-measures ANOVA). Error bars indicate SEM.
Figure 10.
Figure 10.
Simultaneous multiregion recordings show distinct prelick dynamics across striatal and OFC networks. A, Heat plots showing normalized readout values generated by SVM models trained to detect lick onset times. Heat plots reflect trial-averaged readout values of SVM models trained and tested on striatal (left) and OFC (right) network activity from simultaneous recordings from the same mouse (55 units per region, n = 4). Trials are sorted by decreasing latency to lick onset time, indicated by a red tick mark. B, Mean performance of lick onset bin prediction as a function of number of units included in training and testing the SVM models for each simultaneously recorded brain region (55 units per region, n = 4). A two-way, repeated-measures ANOVA revealed a significant effect of number of units (F(5,15) = 178.4, p < 0.0001) and a significant effect of brain region (F(1,3) = 18.9, p = 0.022). The ANOVA excluded the “all units” column because it contained inconsistent numbers of cells between simultaneously recorded regions. C, Heat plots showing normalized readout values generated by SVM models trained to detect time bins occurring 500 ms before actual lick onset times. Heat plots reflect trial-averaged readout values of SVM models trained and tested on striatal (left) and OFC (right) network activity from simultaneous recordings from the same mouse. Trials are sorted by decreasing latency to actual lick onset time, indicated by a red tick mark. Magenta tick marks indicate 500 ms before lick onset (55 units per region, n = 4). D, Mean RMSE values across all simultaneous striatal and OFC recordings (55 units per region, n = 4) quantifying performance of SVM models trained and tested to predict time bins that occurred in advance of actual lick onset times. A two-way, repeated-measures ANOVA revealed a significant effect of time bin (F(15,45) = 8.8, p < 0.0001) and brain region (F(1,3) = 16.0, p = 0.028). Error bars indicate SEM.

References

    1. Averbeck BB, Lee D. Effects of noise correlations on information encoding and decoding. J Neurophysiol. 2006;95:3633–3644. doi: 10.1152/jn.00919.2005. - DOI - PubMed
    1. Averbeck BB, Latham PE, Pouget A. Neural correlations, population coding and computation. Nat Rev Neurosci. 2006;7:358–366. doi: 10.1038/nrn1888. - DOI - PubMed
    1. Bakhurin KI, Mac V, Golshani P, Masmanidis SC. Temporal correlations among functionally specialized striatal neural ensembles in reward conditioned mice. J Neurophysiol. 2016;115:1521–1532. doi: 10.1152/jn.01037.2015. - DOI - PMC - PubMed
    1. Barbera G, Liang B, Zhang L, Gerfen CR, Culurciello E, Chen R, Li Y, Lin DT. Spatially compact neural clusters in the dorsal striatum encode locomotion relevant information. Neuron. 2016;92:202–213. doi: 10.1016/j.neuron.2016.08.037. - DOI - PMC - PubMed
    1. Bartolo R, Prado L, Merchant H. Information processing in the primate basal ganglia during sensory-guided and internally driven rhythmic tapping. J Neurosci. 2014;34:3910–3923. doi: 10.1523/JNEUROSCI.2679-13.2014. - DOI - PMC - PubMed

LinkOut - more resources