

PDE5 Inhibitor Tadalafil and Hydroxychloroquine Cotreatment Provides Synergistic Protection against Type 2 Diabetes and Myocardial Infarction in Mice
- PMID: 28123046
- PMCID: PMC5363764
- DOI: 10.1124/jpet.116.239087
PDE5 Inhibitor Tadalafil and Hydroxychloroquine Cotreatment Provides Synergistic Protection against Type 2 Diabetes and Myocardial Infarction in Mice
Abstract
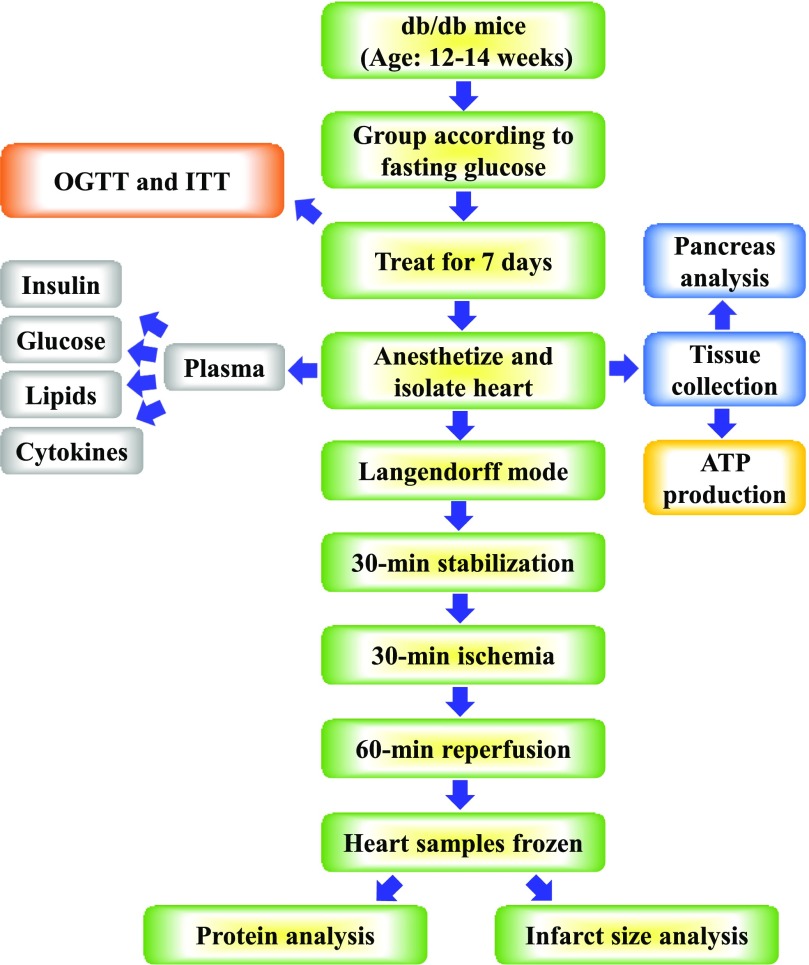
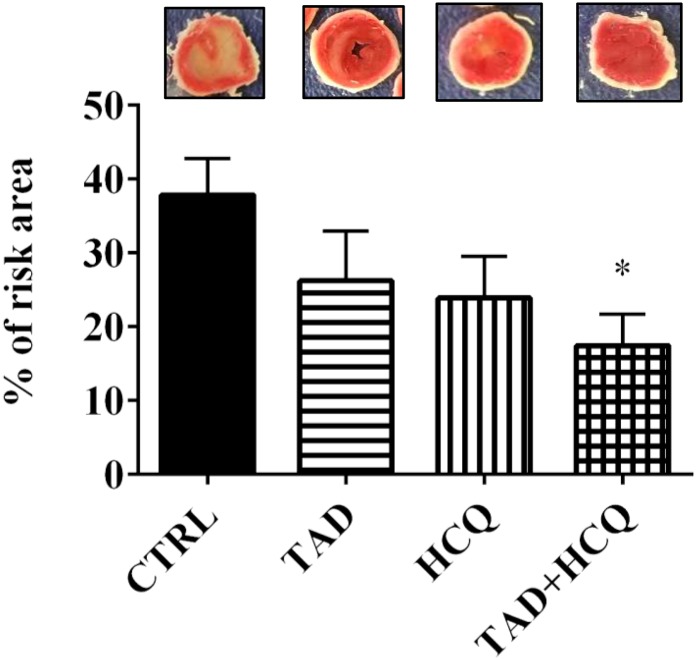
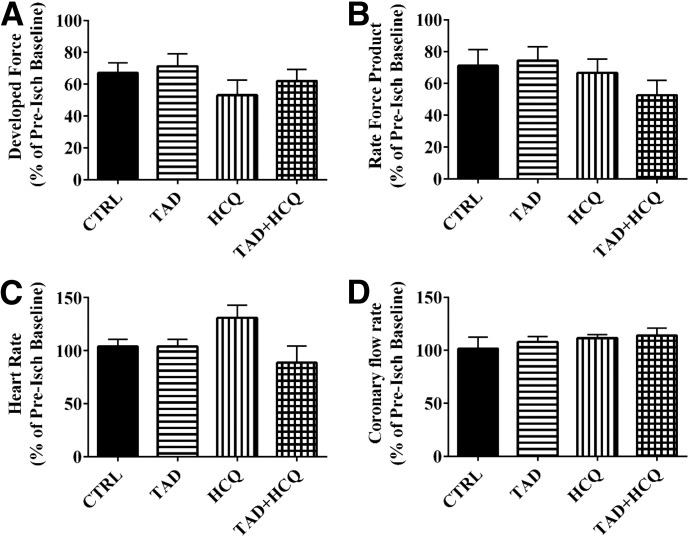
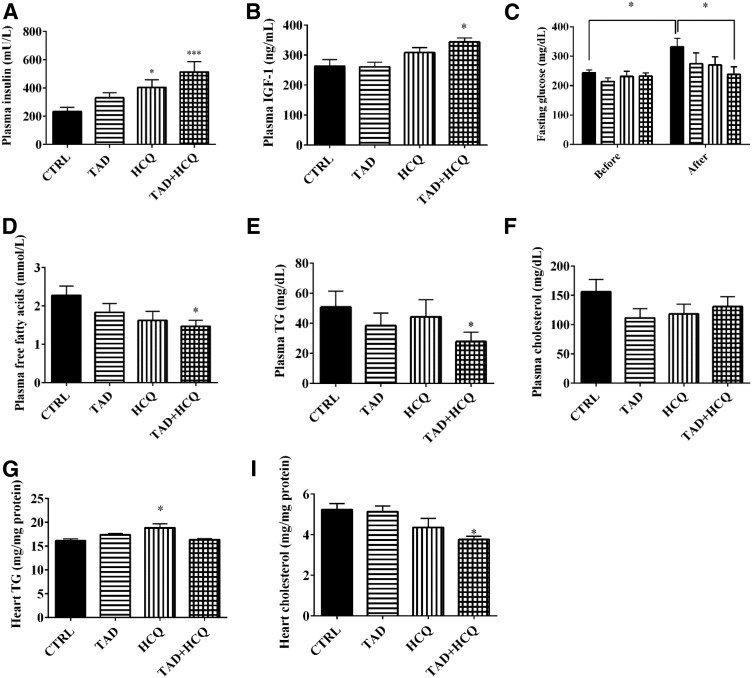
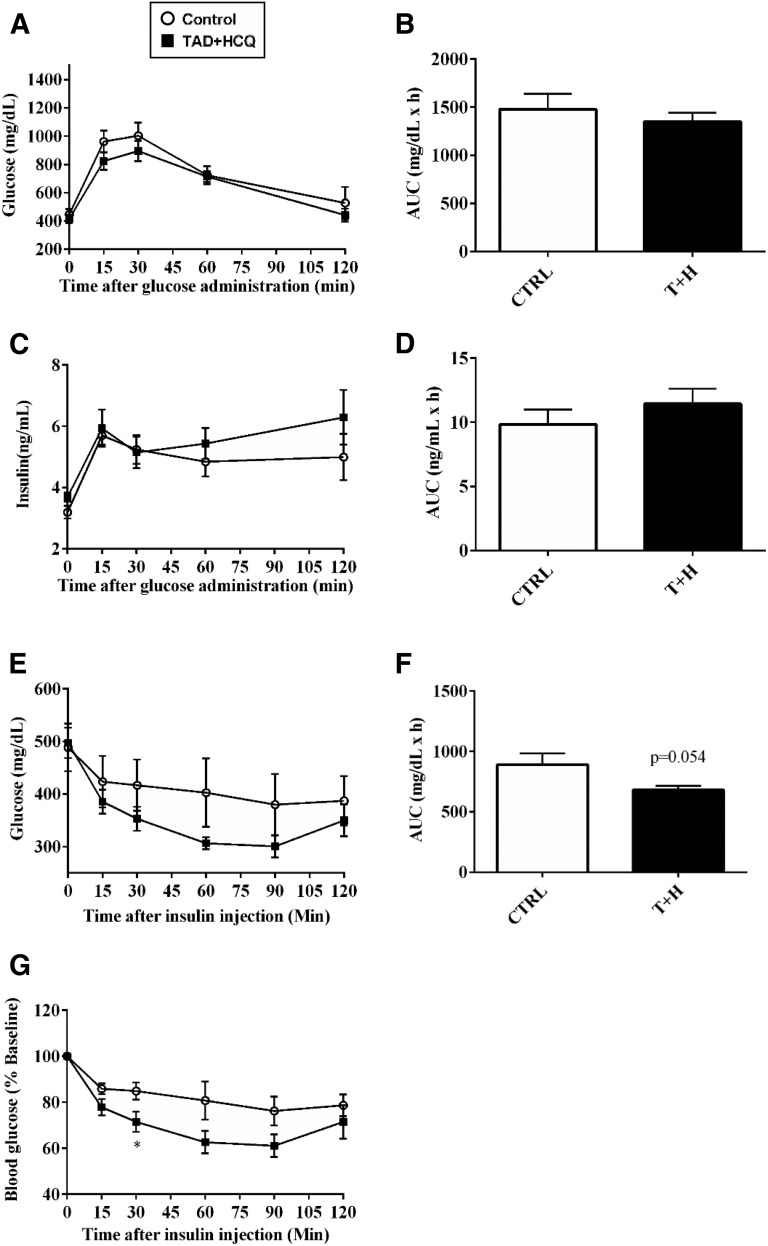
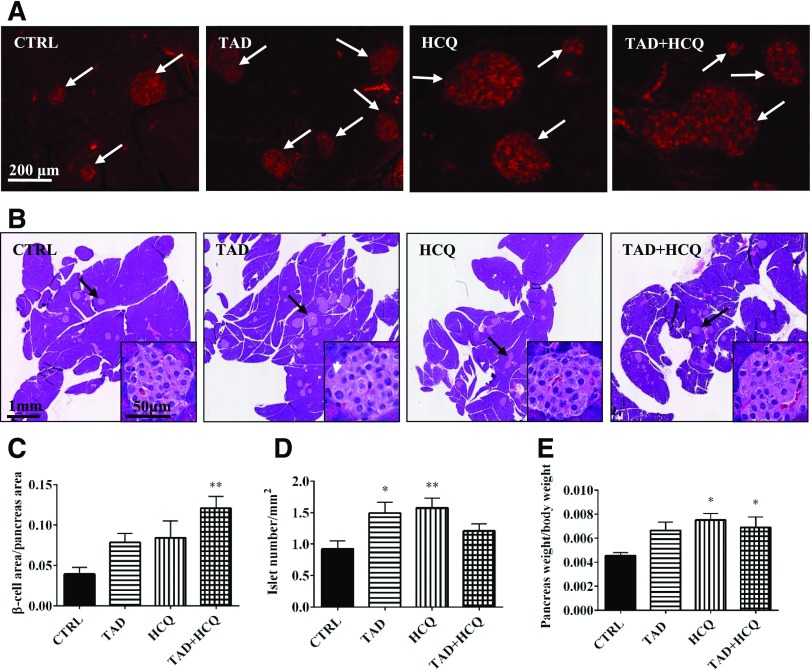
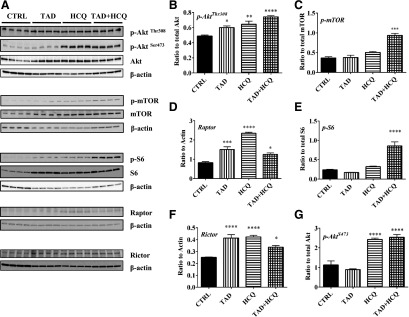
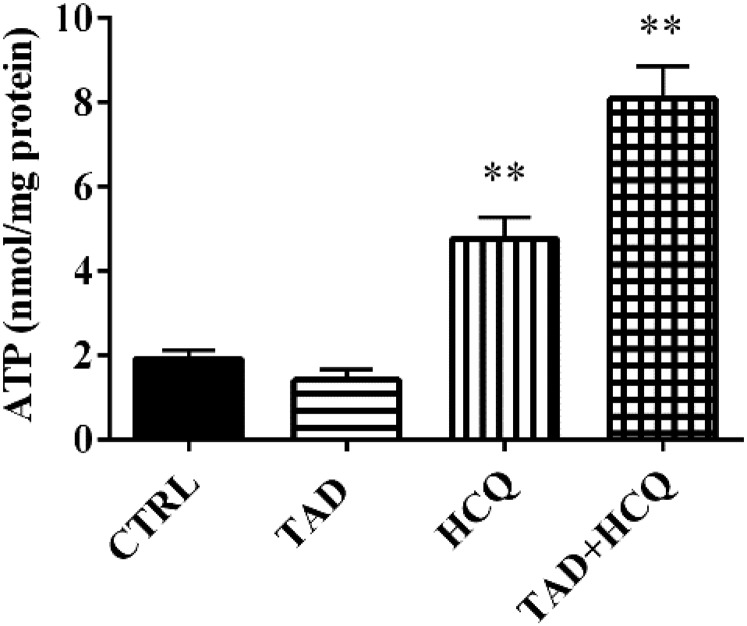
Diabetes is associated with a high risk for ischemic heart disease. We have previously shown that phosphodiesterase 5 inhibitor tadalafil (TAD) induces cardioprotection against ischemia/ reperfusion (I/R) injury in diabetic mice. Hydroxychloroquine (HCQ) is a widely used antimalarial and anti-inflammatory drug that has been reported to reduce hyperglycemia in diabetic patients. Therefore, we hypothesized that a combination of TAD and HCQ may induce synergistic cardioprotection in diabetes. We also investigated the role of insulin-Akt-mammalian target of rapamycin (mTOR) signaling, which regulates protein synthesis and cell survival. Adult male db/db mice were randomized to receive vehicle, TAD (6 mg/kg), HCQ (50 mg/kg), or TAD + HCQ daily by gastric gavage for 7 days. Hearts were isolated and subjected to 30-minute global ischemia, followed by 1-hour reperfusion in Langendorff mode. Cardiac function and myocardial infarct size were determined. Plasma glucose, insulin and lipid levels, and relevant pancreatic and cardiac protein markers were measured. Treatment with TAD + HCQ reduced myocardial infarct size (17.4% ± 4.3% vs. 37.8% ± 4.9% in control group, P < 0.05) and enhanced the production of ATP. The TAD + HCQ combination treatment also reduced fasting blood glucose, plasma free fatty acids, and triglyceride levels. Furthermore, TAD + HCQ increased plasma insulin levels (513 ± 73 vs. 232 ± 30 mU/liter, P < 0.05) with improved insulin sensitivity, larger pancreatic β-cell area, and pancreas mass. Insulin-like growth factor-1 (IGF-1) levels were also elevated by TAD + HCQ (343 ± 14 vs. 262 ± 22 ng/ml, P < 0.05). The increased insulin/IGF-1 resulted in activation of downstream Akt/mTOR cellular survival pathway. These results suggest that combination treatment with TAD and HCQ could be a novel and readily translational pharmacotherapy for reducing cardiovascular risk factors and protecting against myocardial I/R injury in type 2 diabetes.
Copyright © 2017 by The American Society for Pharmacology and Experimental Therapeutics.
Figures
Similar articles
-
Treating diabetes with combination of phosphodiesterase 5 inhibitors and hydroxychloroquine-a possible prevention strategy for COVID-19?Mol Cell Biochem. 2023 Mar;478(3):679-696. doi: 10.1007/s11010-022-04520-2. Epub 2022 Aug 29. Mol Cell Biochem. 2023. PMID: 36036333 Free PMC article. Review.
-
Anti-inflammatory and cardioprotective effects of tadalafil in diabetic mice.PLoS One. 2012;7(9):e45243. doi: 10.1371/journal.pone.0045243. Epub 2012 Sep 21. PLoS One. 2012. PMID: 23028874 Free PMC article.
-
Chronic inhibition of phosphodiesterase 5 with tadalafil affords cardioprotection in a mouse model of metabolic syndrome: role of nitric oxide.Mol Cell Biochem. 2020 May;468(1-2):47-58. doi: 10.1007/s11010-020-03710-0. Epub 2020 Mar 11. Mol Cell Biochem. 2020. PMID: 32162053 Free PMC article.
-
Phosphodiesterase-5 inhibitor tadalafil attenuates oxidative stress and protects against myocardial ischemia/reperfusion injury in type 2 diabetic mice.Free Radic Biol Med. 2013 Jul;60:80-8. doi: 10.1016/j.freeradbiomed.2013.01.031. Epub 2013 Feb 4. Free Radic Biol Med. 2013. PMID: 23385031
-
Therapy and pharmacological properties of hydroxychloroquine and chloroquine in treatment of systemic lupus erythematosus, rheumatoid arthritis and related diseases.Inflammopharmacology. 2015 Oct;23(5):231-69. doi: 10.1007/s10787-015-0239-y. Epub 2015 Aug 6. Inflammopharmacology. 2015. PMID: 26246395 Review.
Cited by
-
Oral nano-formulation improves pancreatic islets dysfunction via lymphatic transport for antidiabetic treatment.Acta Pharm Sin B. 2023 Jul;13(7):3137-3152. doi: 10.1016/j.apsb.2022.12.014. Epub 2022 Dec 22. Acta Pharm Sin B. 2023. PMID: 37521855 Free PMC article.
-
Potential Effect of Hydroxychloroquine in Diabetes Mellitus: A Systematic Review on Preclinical and Clinical Trial Studies.J Diabetes Res. 2020 Feb 27;2020:5214751. doi: 10.1155/2020/5214751. eCollection 2020. J Diabetes Res. 2020. PMID: 32190699 Free PMC article.
-
Crocin attenuates oxidative stress and inflammation in myocardial infarction induced by isoprenaline via PPARγ activation in diabetic rats.J Diabetes Metab Disord. 2020 Nov 18;19(2):1517-1525. doi: 10.1007/s40200-020-00686-y. eCollection 2020 Dec. J Diabetes Metab Disord. 2020. PMID: 33553037 Free PMC article.
-
Treating diabetes with combination of phosphodiesterase 5 inhibitors and hydroxychloroquine-a possible prevention strategy for COVID-19?Mol Cell Biochem. 2023 Mar;478(3):679-696. doi: 10.1007/s11010-022-04520-2. Epub 2022 Aug 29. Mol Cell Biochem. 2023. PMID: 36036333 Free PMC article. Review.
-
Repurposing New Use for Old Drug Chloroquine against Metabolic Syndrome: A Review on Animal and Human Evidence.Int J Med Sci. 2021 May 13;18(12):2673-2688. doi: 10.7150/ijms.58147. eCollection 2021. Int J Med Sci. 2021. PMID: 34104100 Free PMC article. Review.
References
-
- Abbas A, Grant PJ, Kearney MT. (2008) Role of IGF-1 in glucose regulation and cardiovascular disease. Expert Rev Cardiovasc Ther 6:1135–1149. - PubMed
-
- Anderson RJ. (1995) Hydroxychloroquine therapy in rheumatic diseases. Bull Rheum Dis 44:6–7. - PubMed
-
- Barsotti A, Giannoni A, Di Napoli P, Emdin M. (2009) Energy metabolism in the normal and in the diabetic heart. Curr Pharm Des 15:836–840. - PubMed
-
- Bili A, Sartorius JA, Kirchner HL, Morris SJ, Ledwich LJ, Antohe JL, Dancea S, Newman ED, Wasko MC. (2011) Hydroxychloroquine use and decreased risk of diabetes in rheumatoid arthritis patients. J Clin Rheumatol 17:115–120. - PubMed
-
- Blazar BR, Whitley CB, Kitabchi AE, Tsai MY, Santiago J, White N, Stentz FB, Brown DM. (1984) In vivo chloroquine-induced inhibition of insulin degradation in a diabetic patient with severe insulin resistance. Diabetes 33:1133–1137. - PubMed
Publication types
MeSH terms
Substances
Grants and funding
LinkOut - more resources
Full Text Sources
Other Literature Sources
Medical
Research Materials
Miscellaneous
