Comparative Study
. 2017 Jan;7(1):160267.
doi: 10.1098/rsob.160267.

Tracing the dynamics of gene transcripts after organismal death

Affiliations
Comparative Study

Tracing the dynamics of gene transcripts after organismal death

Alex E Pozhitkov et al. Open Biol. 2017 Jan.

Abstract

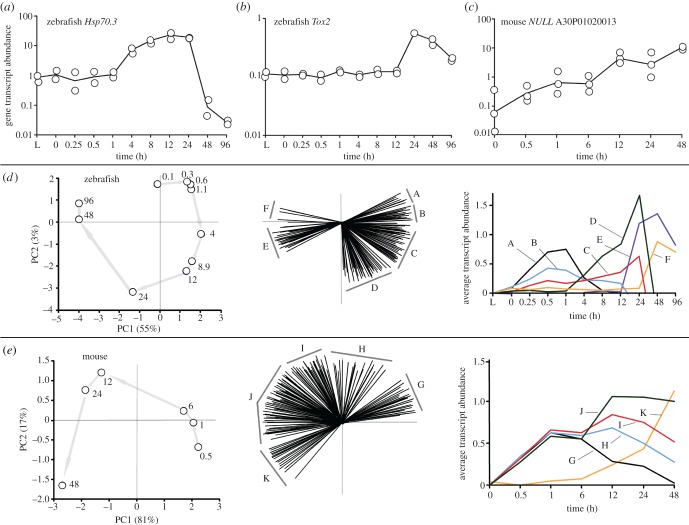
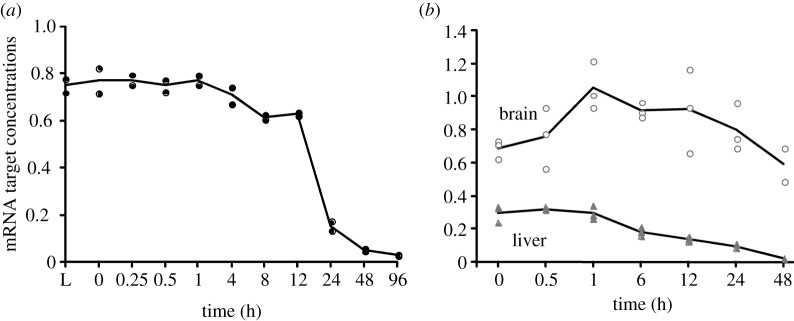
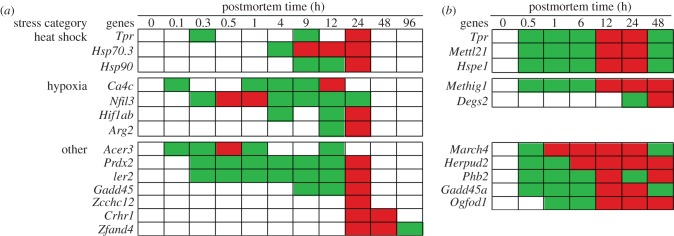
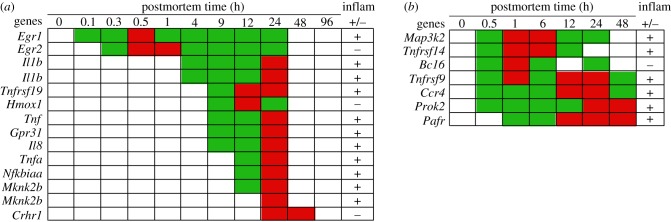
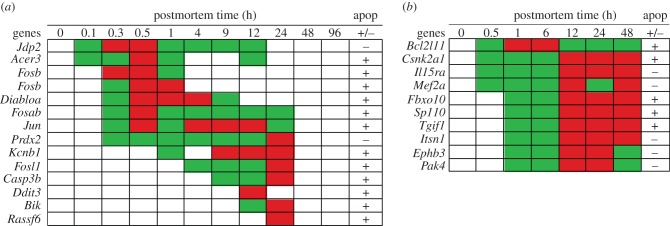
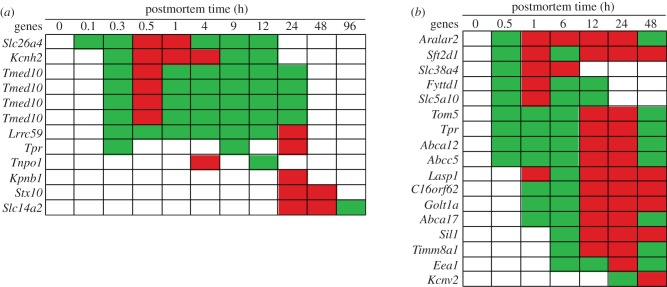
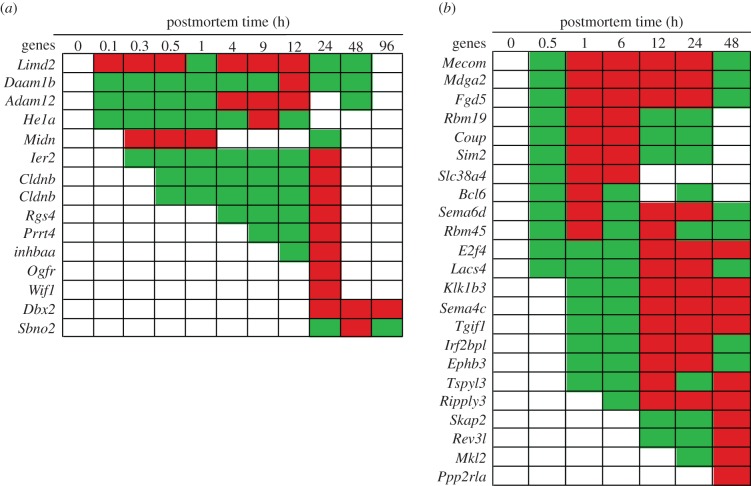
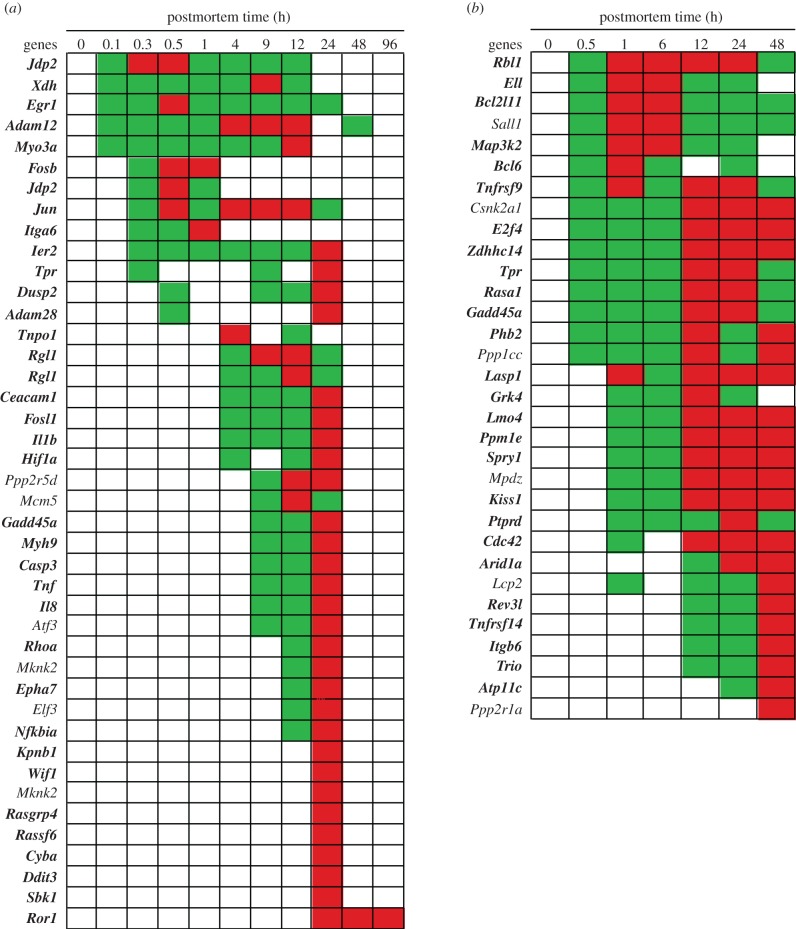
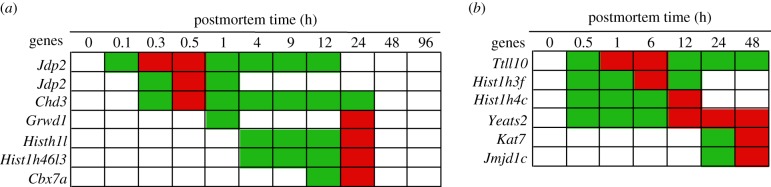
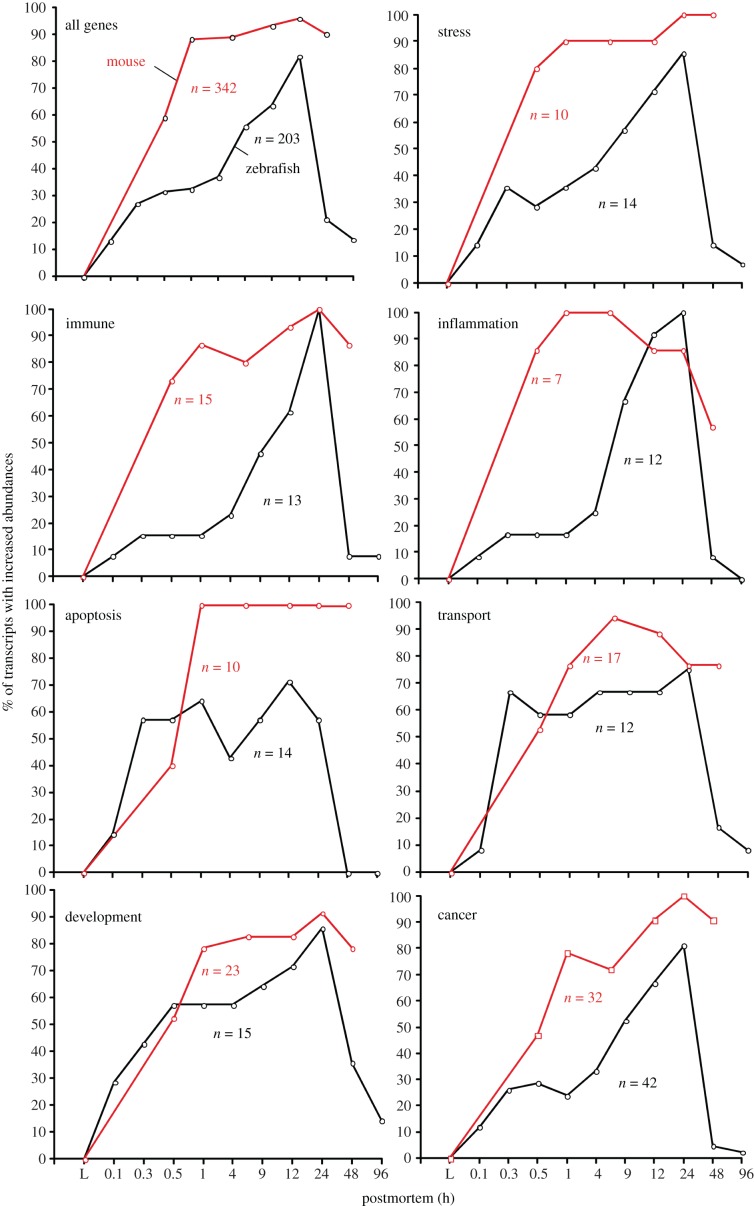
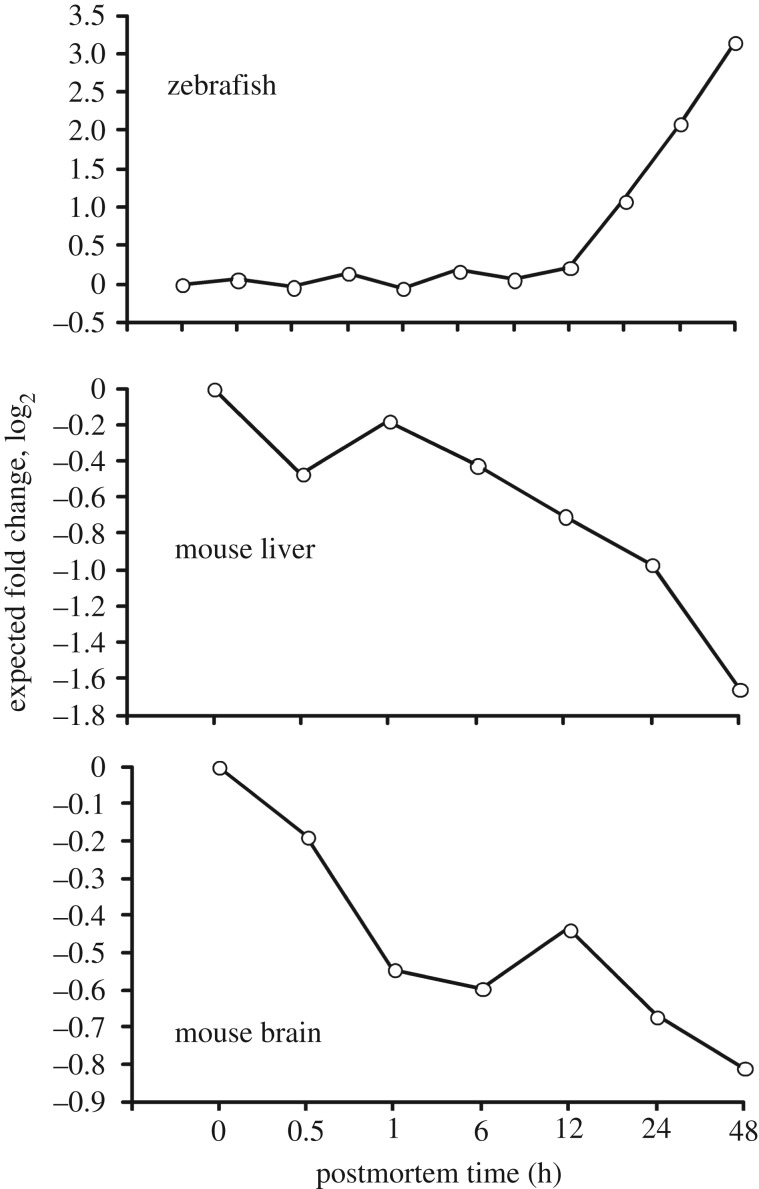
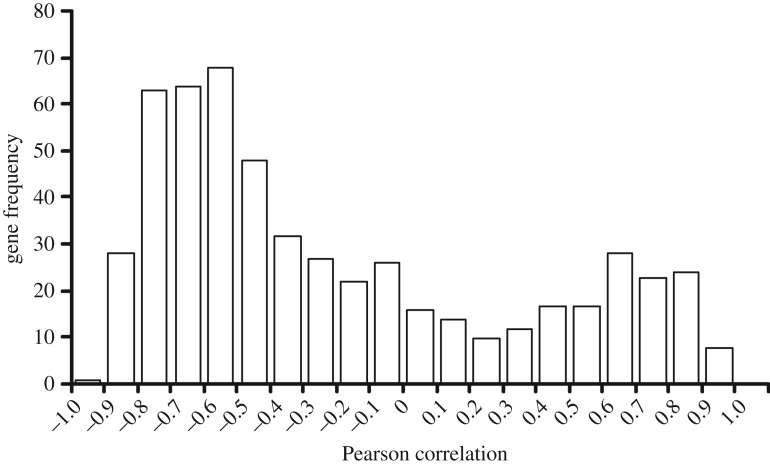
In life, genetic and epigenetic networks precisely coordinate the expression of genes-but in death, it is not known if gene expression diminishes gradually or abruptly stops or if specific genes and pathways are involved. We studied this by identifying mRNA transcripts that apparently increase in relative abundance after death, assessing their functions, and comparing their abundance profiles through postmortem time in two species, mouse and zebrafish. We found mRNA transcript profiles of 1063 genes became significantly more abundant after death of healthy adult animals in a time series spanning up to 96 h postmortem. Ordination plots revealed non-random patterns in the profiles by time. While most of these transcript levels increased within 0.5 h postmortem, some increased only at 24 and 48 h postmortem. Functional characterization of the most abundant transcripts revealed the following categories: stress, immunity, inflammation, apoptosis, transport, development, epigenetic regulation and cancer. The data suggest a step-wise shutdown occurs in organismal death that is manifested by the apparent increase of certain transcripts with various abundance maxima and durations.

Keywords: Gene Meters; cancer; developmental control; forensic science; postmortem transcriptome; transplantology.


Figures

Figure 1.
Figure 1.
Transcriptional profiles of representative genes (arb. units), ordination plots based on transcript abundances by postmortem time (h) with corresponding transcript contributions (biplots), and averaged transcript abundances by group. (a–c) Transcriptional profiles of (a) the Hsp70.3 gene, (b) the Tox2 gene and (c) a non-annotated transcript ‘NULL’ (i.e. no annotation, probe number shown) gene as a function of postmortem time. (d,e) Ordination plots of the (d) zebrafish and (e) mouse were based on all gene transcript profiles found to have a significantly increased abundance. Gene transcripts in the biplots were arbitrarily assigned alphabetical groups based on their positions in the ordination. The average transcript abundances for each group are shown.
Figure 2.
Figure 2.
Total mRNA abundance (arbitrary units, arb. units) by postmortem time determined using all calibrated microarray probes: (a) extracted from whole zebrafish, (b) extracted from the brain and liver tissues of whole mice. Each datum point represents the mRNA from two individuals in the zebrafish and a single individual in the mouse.
Figure 3.
Figure 3.
Increased abundance of stress response gene transcripts by postmortem time (h) and stress category: (a) zebrafish and (b) mouse. Green, intermediate value; red, maximum value.
Figure 4.
Figure 4.
Abundance of immunity gene transcripts by postmortem time (h): (a) zebrafish and (b) mouse. Green, intermediate value; red, maximum value. Some transcripts were represented by two different probes (e.g. Il1b, Laao).
Figure 5.
Figure 5.
Abundance of inflammation gene transcripts by postmortem time (h): (a) zebrafish and (b) mouse. Inflammation, pro-, +; anti, −. Green, intermediate value; red, maximum value. The Il1b and Mknk2b genes were represented by two different probes.
Figure 6.
Figure 6.
Abundance of apoptosis gene transcripts by postmortem time (h): (a) zebrafish and (b) mouse. Apoptosis, pro-, +; anti, −. Green, intermediate value; red, maximum value. The Fosb gene was represented by two different probes.
Figure 7.
Figure 7.
Abundance of transport gene transcripts by postmortem time (h): (a) zebrafish and (b) mouse. Green, intermediate value; red, maximum value. The Tmed10 gene was represented by four different probes.
Figure 8.
Figure 8.
Abundance of development gene transcripts by postmortem time (h): (a) zebrafish and (b) mouse. Green, intermediate value; red, maximum value. The Cldnb gene was represented by two different probes.
Figure 9.
Figure 9.
Abundance of cancer gene transcripts by postmortem time (h): (a) zebrafish and (b) mouse. Green, intermediate value; red, maximum value. Bold gene name means it was found in more than one cancer database. The Rgl1 gene was represented by two different probes.
Figure 10.
Figure 10.
Abundance of epigenetic gene transcripts by postmortem time (h): (a) zebrafish and (b) mouse. Green, intermediate value; red, maximum value. Bold gene name means it was found in more than one cancer database. The Jdp2 gene was represented by two different probes.
Figure 11.
Figure 11.
Percentage of transcripts with increased abundances by postmortem time and category. Number of total genes by organism and category are shown. ‘All genes’ refer to the gene transcripts that significantly contributed to the ordination plots. Mouse is red and zebrafish is black.
Figure 12.
Figure 12.
Expected fold change of a putatively stable cRNA by postmortem time. Fold change was determined by subtracting the log2 of the inverted concentration in µl ng−1 of the extracted cRNA of the live controls from the inverted concentration of extracted cRNA at each sampling time.
Figure 13.
Figure 13.
Distribution of the correlations of the expected fold change and relative gene transcript abundance by postmortem time for the zebrafish. We only considered probes targeting gene transcripts that significantly increased with postmortem time relative to the live controls (n = 548). Correlations above 0.685 were significant at α = 0.01 and indicate the possibility of enrichment of the stable cRNA.
Figure 14.
Figure 14.
Comparison of expected fold change (grey) based on total cRNA extracted relative to live control versus specific gene transcript profiles (black) by postmortem time. (ac) Relative transcript abundances that are highly correlated with expected fold change and are therefore putatively enriched and/or stable. (d) A transcript profile that is negatively correlated with expected fold change and therefore neither enriched nor stable.

References

    1. Monod J. 1961. Genetic regulatory mechanisms in the synthesis of proteins. J. Mol. Biol. 3, 318–356. (doi:10.1016/S0022-2836(61)80072-7) - DOI - PubMed
    1. Zong WX, Thompson CB. 2006. Necrotic death as a cell fate. Genes Dev. 20, 1–15. (doi:10.1101/gad.1376506) - DOI - PubMed
    1. Galluzzi L, Bravo-San Pedro JM, Kroemer G. 2014. Organelle-specific initiation of cell death. Nat. Cell. Biol. 16, 728–736. (doi:10.1038/ncb3005) - DOI - PubMed
    1. Ferri KF, Kroemer G. 2001. Organelle-specific initiation of cell death pathways. Nat. Cell. Biol. 3, E255–E263. (doi:10.1038/ncb1101-e255) - DOI - PubMed
    1. Syntichaki P, Tavernarakis N. 2002. Death by necrosis. Uncontrollable catastrophe, or is there order behind the chaos? EMBO Rep. 3, 604–609. (doi:10.1093/embo-reports/kvf138) - DOI - PMC - PubMed

Publication types

LinkOut - more resources