. 2017 Feb 22;37(8):2161-2175.
doi: 10.1523/JNEUROSCI.3124-16.2017. Epub 2017 Jan 25.

Zika Virus Targeting in the Developing Brain

Affiliations

Zika Virus Targeting in the Developing Brain

Anthony N van den Pol et al. J Neurosci. .

Abstract

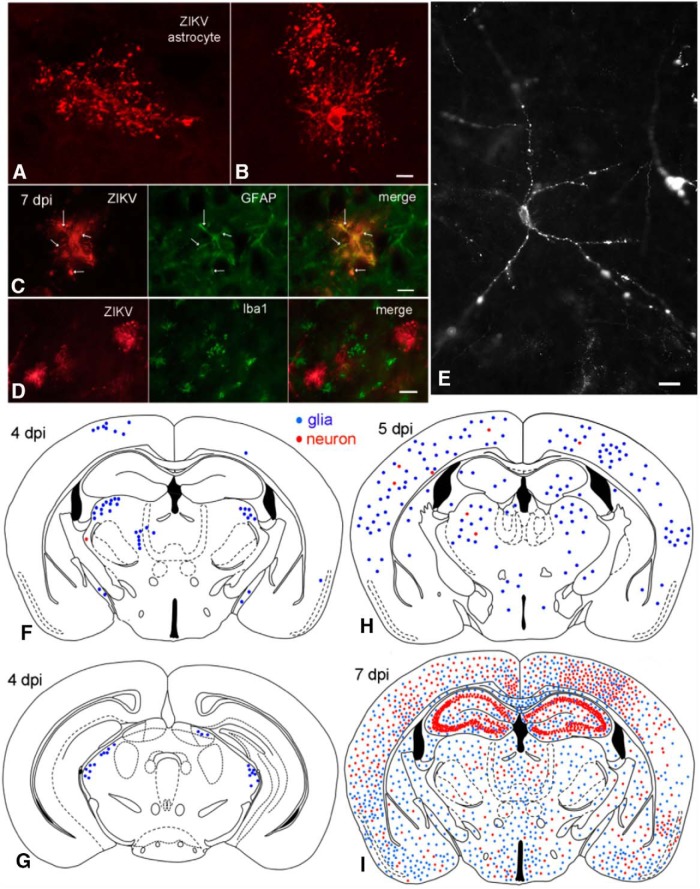
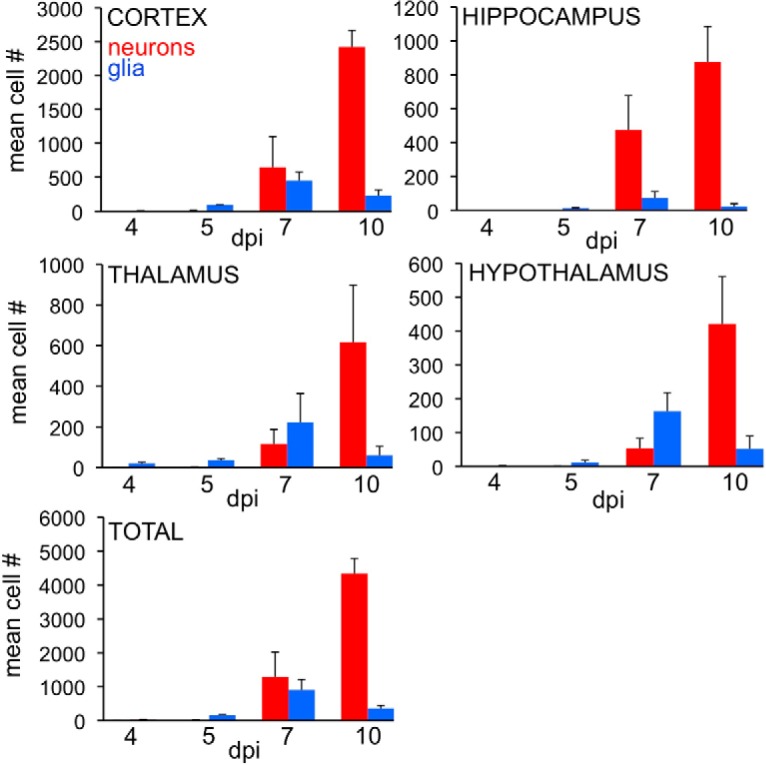
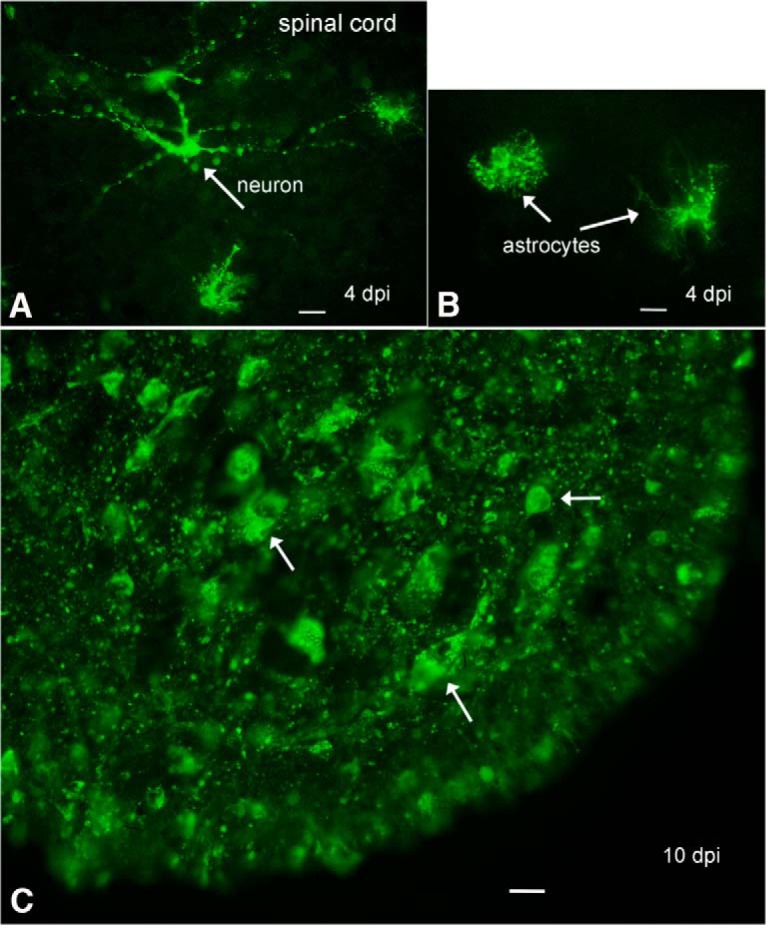
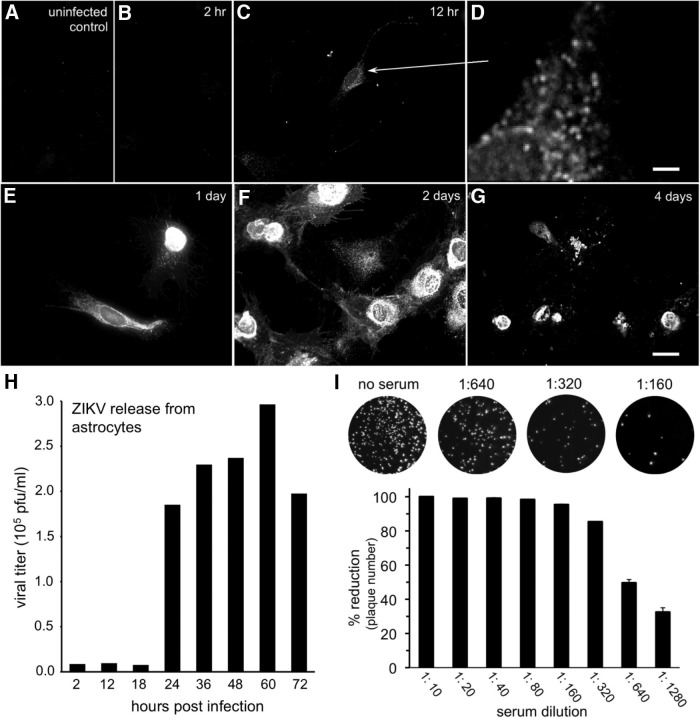
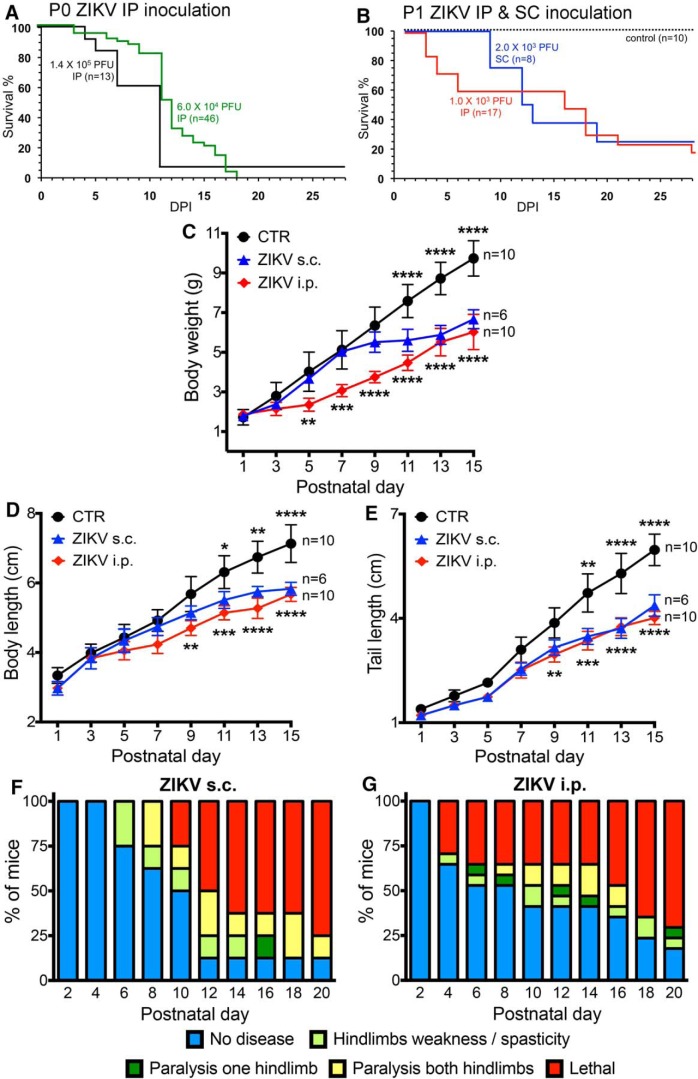
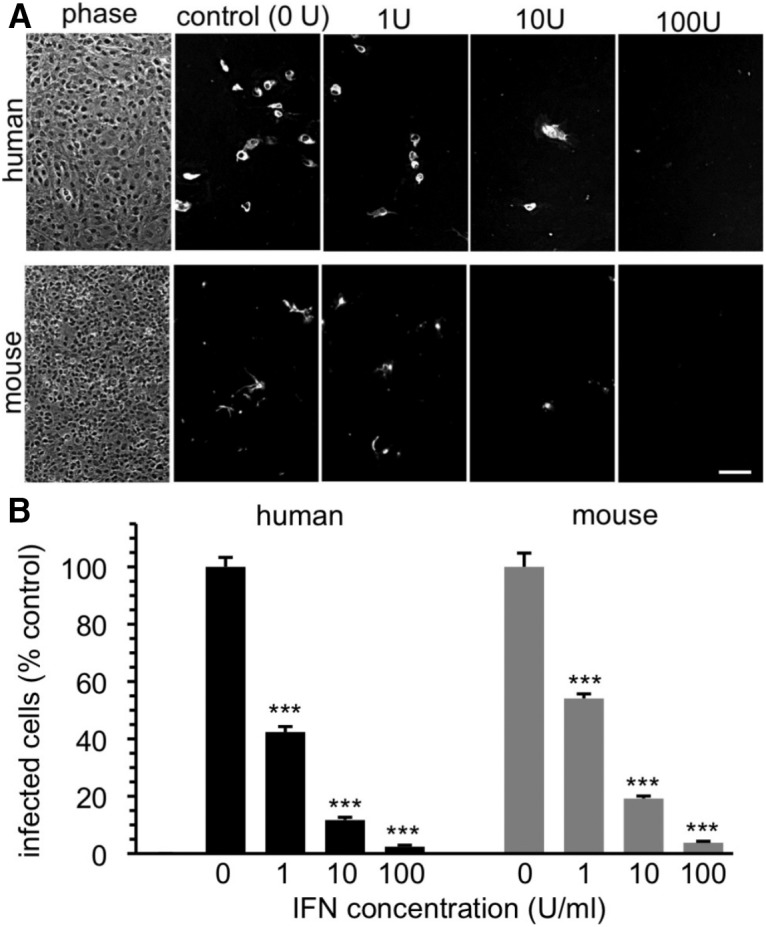
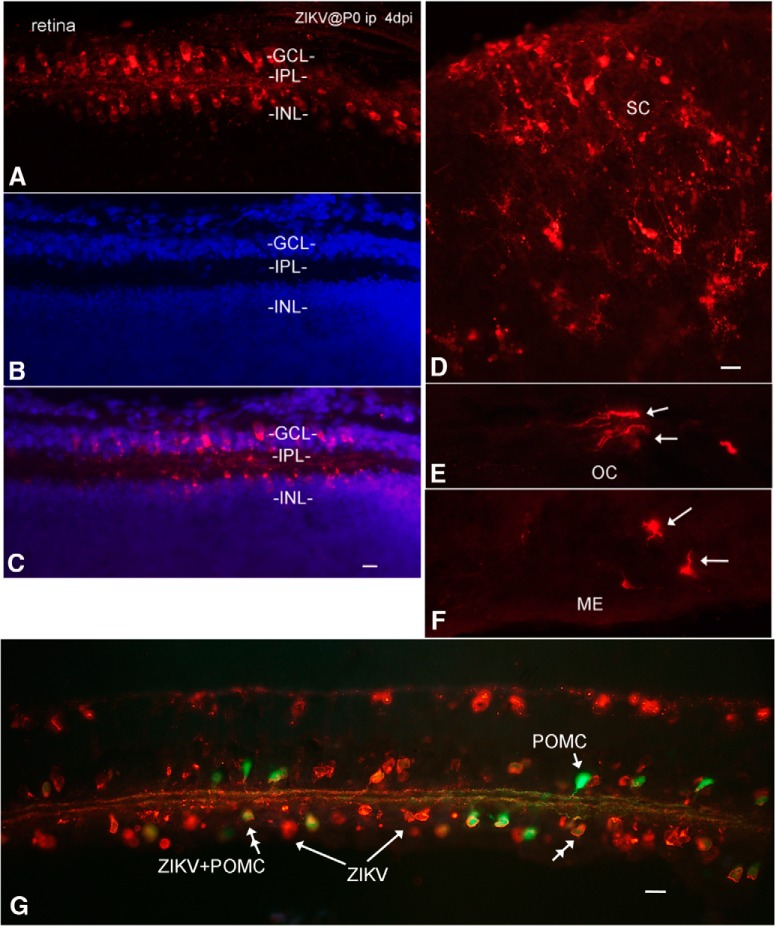
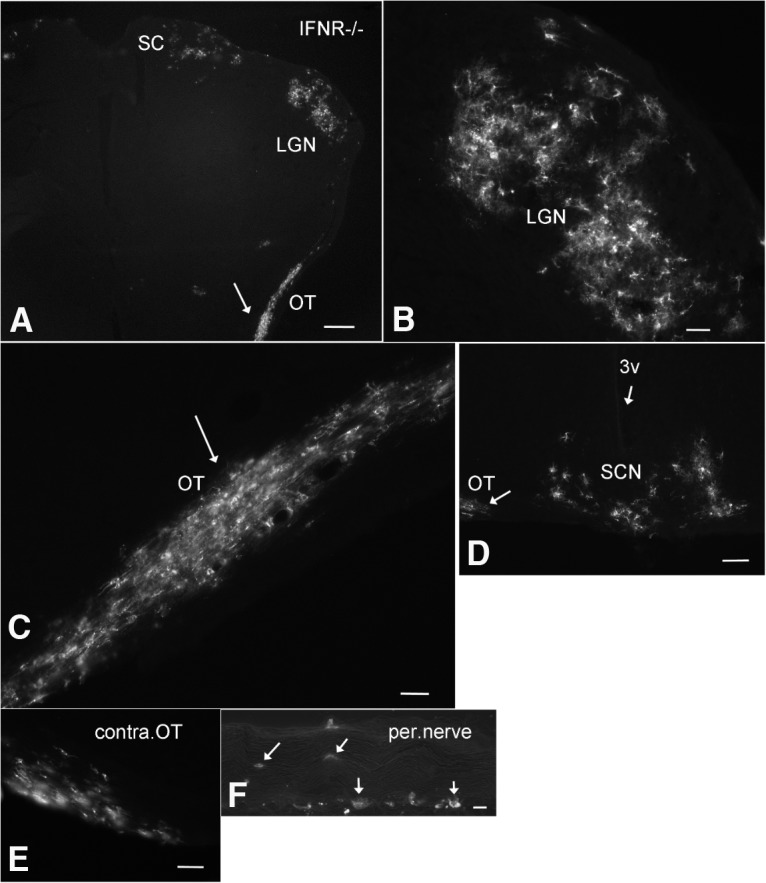
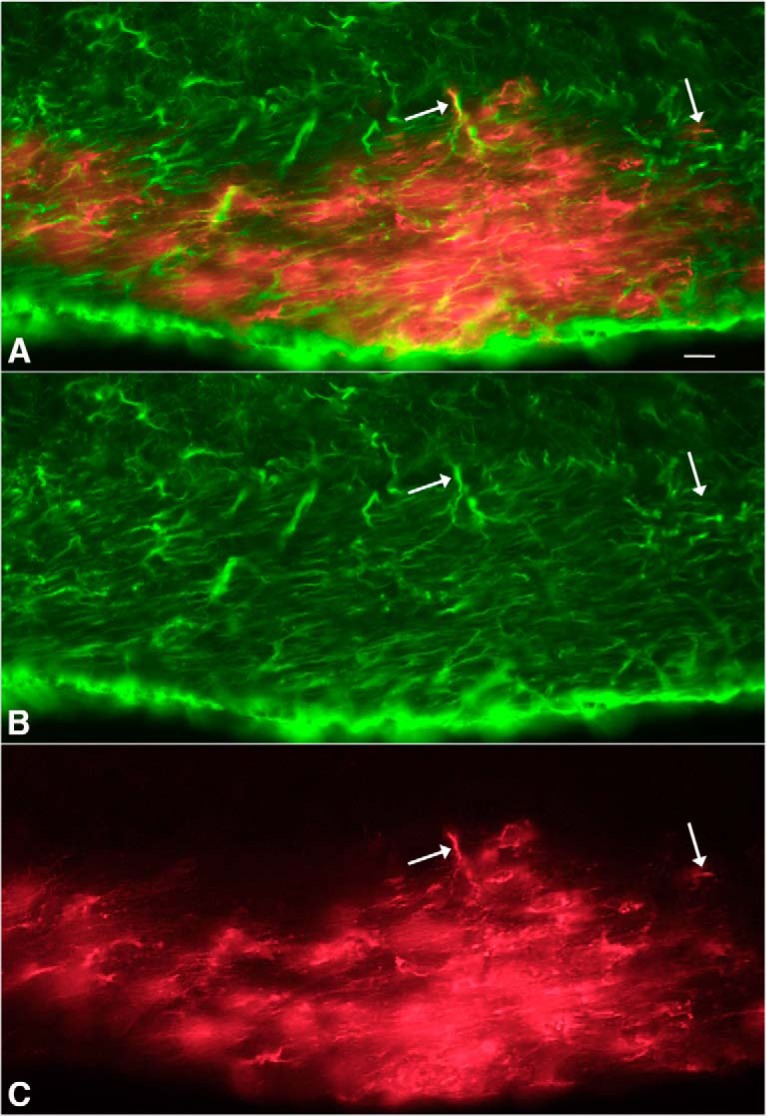
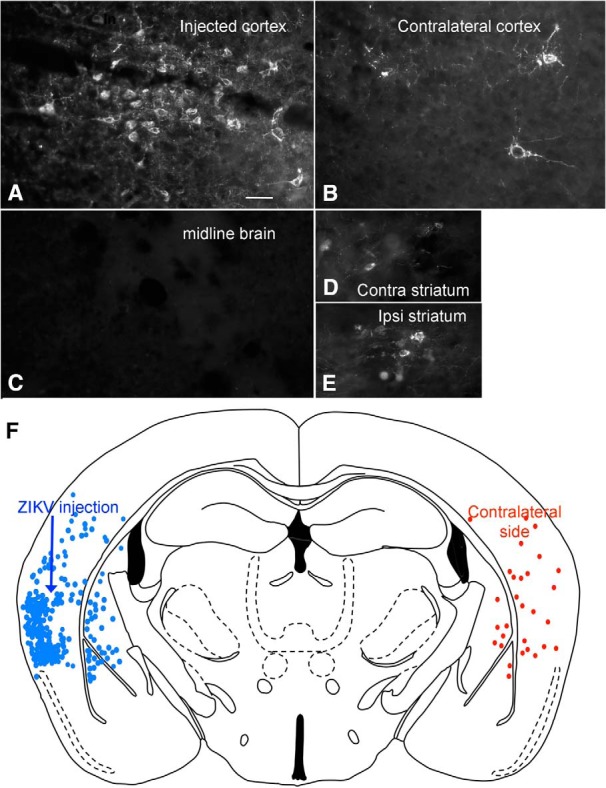
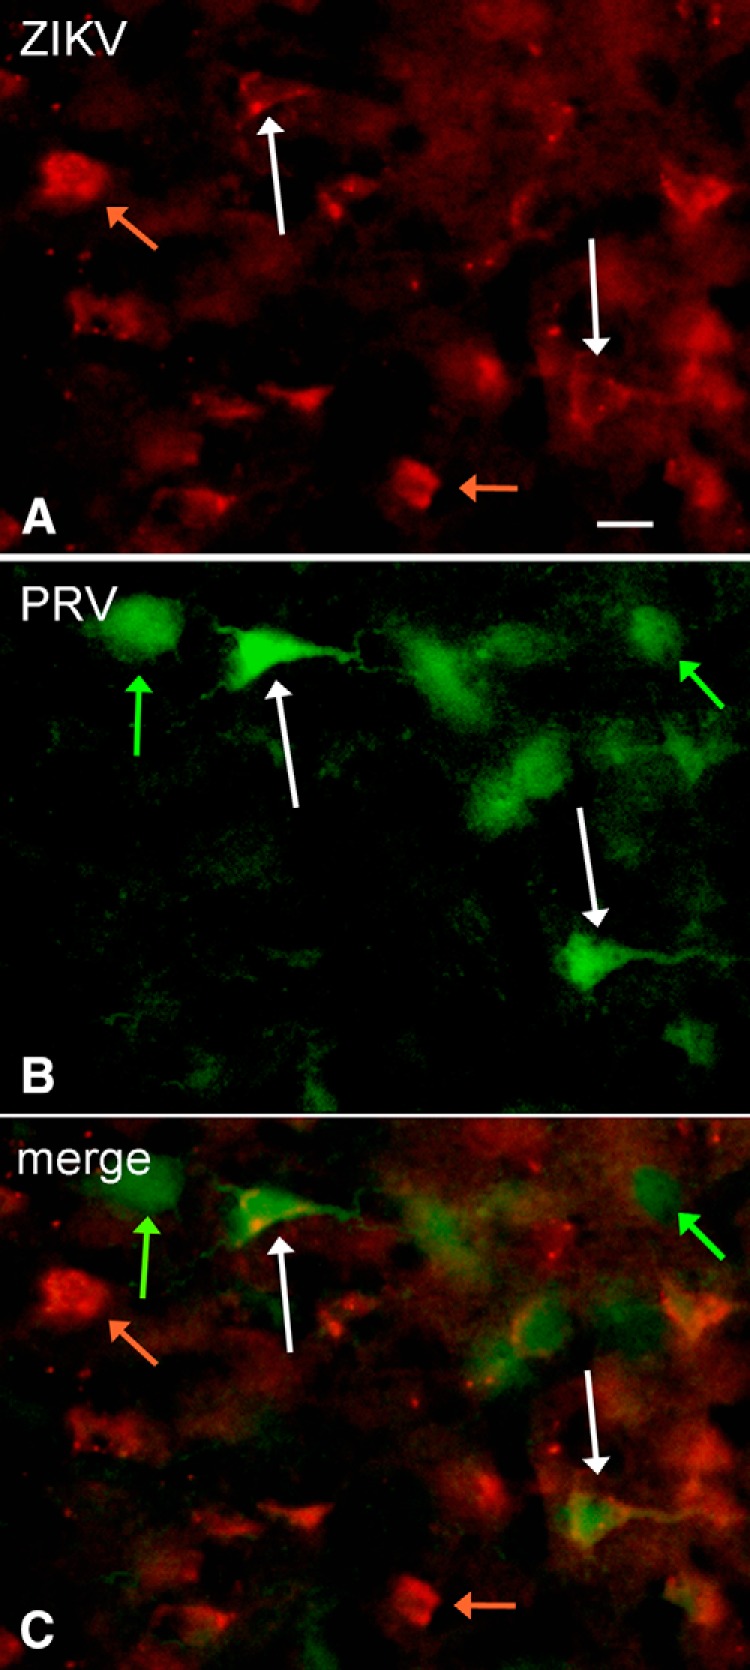
Zika virus (ZIKV), a positive-sense RNA flavivirus, has attracted considerable attention recently for its potential to cause serious neurological problems, including microcephaly, cortical thinning, and blindness during early development. Recent findings suggest that ZIKV infection of the brain can occur not only during very early stages of development, but also in later fetal/early neonatal stages of maturation. Surprisingly, after peripheral inoculation of immunocompetent mice on the day of birth, the first cells targeted throughout the brain were isolated astrocytes. At later stages, more neurons showed ZIKV immunoreactivity, in part potentially due to ZIKV release from infected astrocytes. In all developing mice studied, we detected infection of retinal neurons; in many mice, this was also associated with infection of the lateral geniculate, suprachiasmatic nuclei, and superior colliculus, suggesting a commonality for the virus to infect cells of the visual system. Interestingly, in mature mice lacking a Type 1 interferon response (IFNR-/-), after inoculation of the eye, the initial majority of infected cells in the visual system were glial cells along the optic tract. ZIKV microinjection into the somatosensory cortex on one side of the normal mouse brain resulted in mirror infection restricted to the contralateral somatosensory cortex without any infection of midline brain regions, indicating the virus can move by axonal transport to synaptically coupled brain loci. These data support the view that ZIKV shows considerable complexity in targeting the CNS and may target different cells at different stages of brain development.SIGNIFICANCE STATEMENT Zika virus (ZIKV) can cause substantial damage to the developing human brain. Here we examine a developmental mouse model of ZIKV infection in the newborn mouse in which the brain is developmentally similar to a second-trimester human fetus. After peripheral inoculation, the virus entered the CNS in all mice tested and initially targeted astrocytes throughout the brain. Infections of the retina were detected in all mice, and infection of CNS visual system nuclei in the brain was common. We find that ZIKV can be transported axonally, thereby enhancing virus spread within the brain. These data suggest that ZIKV infects multiple cell types within the brain and that astrocyte infection may play a more important role in initial infection than previously appreciated.

Keywords: astrocyte; behavior dysfunction; development; infection; neurotropic; virus.


Figures

Figure 1.
Figure 1.
ZIKV enters brain after intraperitoneal inoculation. A, B, Confocal scanning microscope images of ZIKV-infected astrocytes. Scale bar, 8 μm. C, ZIKV-infected glial cell (red) contains GFAP immunoreactivity (green). The ZIKV immunoreactivity is found out to the tips of the glial processes, whereas the GFAP is confined more to the shaft of primary and secondary processes. Scale bar, 10 μm. D, No colocalization of ZIKV and Iba1 (a microglia marker) was detected. Scale bar, 12 μm. E, ZIKV-infected neuron with punctate immunoreactivity at 7 dpi after P0 inoculation. Scale bar, 15 μm. F, G, At 4 dpi after intraperitoneal inoculation, most infected cells are glia (blue dots); only rare neurons (red dots) are infected. G, More caudal midbrain region of the same mouse as in F. H, More cells, particularly astrocytes, are infected at 5 dpi. I, At 7 dpi after intraperitoneal inoculation, ZIKV has spread throughout the brain. At this stage of development, ZIKV infects glia (blue) and neurons (red) with little preference for brain regions, with the exception in this case of strong hippocampal neuron infection, including the dentate gyrus, CA3, and CA1.
Figure 2.
Figure 2.
Relative number of infected astrocytes and neurons/section during development. The number of immunoreactive astrocytes (blue) and neurons (red) was counted at 4, 5, 7, and 10 dpi (n = 3/time point). Bar indicates SD. Initially at 4 and 5 dpi, most of the cells had the morphology of astrocytes in all 4 areas studied. By 7 dpi, astrocytes were still more numerous than neurons in thalamus and hypothalamus, whereas neurons were more numerous in cortex and hippocampus. By 10 dpi, infected neurons were more prevalent in all areas studied.
Figure 3.
Figure 3.
Cortical neurons infected with ZIKV 7 dpi after intraperitoneal inoculation at P0. Substantive infection is seen in the primary dendrites extending toward the right to the cortical surface. The beaded dendrites are typical of the neuronal deterioration in late stages of ZIKV infection. Scale bar, 30 μm.
Figure 4.
Figure 4.
ZIKV heterogeneity of infection in cerebellum. At 7 dpi after intraperitoneal inoculation at P0, the cerebellum from the same mouse shows different stages and cell types of infection in different lobes of the cerebellar cortex in A–C. A, Arrows indicate Purkinje cells in Purkinje cell layer and punctate labeling suggestive of late-stage infection in the granule layer. B, Thin processes in the molecular layer are seen, and a large number of cells in the granule layer. C, Unlike in B, few processes or infected cells are detected in the molecular layer. Scale bar, 30 μm. iGL, Internal granule cell layer; PL, Purkinje cell layer containing cell bodies of Purkinje cells and Bergmann glia; ML, molecular layer.
Figure 5.
Figure 5.
ZIKV in spinal cord. A, In the lumbar spinal cord gray matter, an immunoreactive degenerating neuron is seen (arrow) along with some immunoreactive glia, 4 dpi. Scale bar, 20 μm. B, Two immunoreactive astrocytes are shown (arrows), 4 dpi. Scale bar, 20 μm. C, By 10 dpi, the ventral horn of the spinal cord is filled with ZIKV-immunoreactive cells and processes. Scale bar, 15 μm.
Figure 6.
Figure 6.
Time course of ZIKV infection of brain cells. Primary human brain cells, mostly astrocytes, were inoculated at time 0, then fixed and immunostained at the indicated intervals. Immunoreactivity was not seen in uninfected control cultures (A) or at 2 h (B) post inoculation (hpi). C, D, At 12 hpi, faint immunoreactivity was detected in granules (D, enlarged region shown by arrow). Scale bar, 2.5 μm. Immunoreactivity became stronger up to 2 d (E, F) post inoculation (dpi). G, By 4 dpi, many of the immunoreactive cells were dead or dying. Scale bars: A–C, E–G, 25 μm. H, Viral release was measured using additional cultures infected after ZIKV (multiplicity of infection 20) inoculation for 1 h, then washed and supplied with fresh media. Media samples were harvested at the indicated time points, and viral concentration was measured by plaque assay. I, ZIKV antiserum harvested from inoculated rats and used for immunolabeling was tested for the ability to neutralize ZIKV infection in vitro. Top, Counterstained cultures show the decline in viral plaque number after exposure to increasing concentrations of antiserum, corroborating antibody selectivity. Bottom, Bar graph indicates that a 50% reduction in ZIKV plaque number was obtained at 1:640 antiserum dilution. Error bars indicate SEM (n = 4).
Figure 7.
Figure 7.
Zika virus in newborn mice induces neurological disease and death. A, Survival for P0 mice inoculated with 1.4 × 10⁵ (black line, n = 13) or 6 × 10⁴ pfu intraperitoneally (green line, n = 46). Total, n = 59. C57BLand Swiss Webster mice were used; because we found no statistical difference between the two strains, data were combined. B, Survival for slightly older P1 mice with 103 pfu intraperitoneally (n = 17) or 2 × 10³ subcutaneously (n = 8). Noninfected controls, n = 10; total, n = 35. ***p < 0.001, survival at P28 (Log-rank, Mantel-Cox) test. The 25% survival in ZIKV subcutaneously, 22.2% survival in ZIKV intraperitoneal controls (CTR). C–E, Somatic parameters of postnatal development. Data are mean ± SEM. Two-way ANOVA with postnatal day as repeated measures, Holm-Sidak's multiple-comparison test: *p < 0.05; **p < 0.01; ***p < 0.001; ****p < 0.0001. ZIKV subcutaneously versus CTR shown above CTR line; ZIKV intraperitoneally versus CTR shown below ZIKV intraperitoneal line. F, Neurological symptoms were assessed for 20 d for P1 mice inoculated subcutaneously with 2 × 10³ pfu ZIKV similar to the observations of Lazear et al. (2016) in older mice. Chart shows that neurological symptoms occur in greater numbers of mice over time. G, P1 mice were infected intraperitoneally with 103 pfu with ZIKV and signs of neurological dysfunction assessed for 20 d. The percentage of each group of mice displaying the indicated motor dysfunction is shown. These are from the same mice evaluated for lethality and somatic development.
Figure 8.
Figure 8.
Type 1 IFN blocks ZIKV infection of human and mouse brain cells. A, Human (top) and mouse (bottom) brain cells were inoculated with ZIKV in the absence (0 U) or presence of 1, 10, and 100 U/ml IFN (Sigma I4401). Left, Phase shows typical cell density. Cells were fixed and immunostained at 2 dpi. Scale bar, 100 μm. B, Bar graph represents percentage infected cells, with controls set to 100%. IFN reduces infection in a dose-dependent manner. Error bars indicate SEM (n = 3). ***p < 0.01 (ANOVA with Bonferroni post-test).
Figure 9.
Figure 9.
Infection of visual system and other brain loci after intraperitoneal inoculation. A–C, Retina at 4 dpi after P0 inoculation; intraperitoneal ZIKV infects the ganglion cell layer (GCL) and the inner nuclear layer (INL). Immunoreactive processes are found in the internal plexiform layer (IPL). Red represents ZIKV immunoreactivity. Blue represents DAPI counterstain. Scale bar, 8 μm. D, ZIKV in superior colliculus. E, ZIKV in optic chiasm (OC). F, Directly caudal to the optic chiasm is the median eminence (ME), which also showed infection. Scale bar, 15 μm. G, Transgenic mouse expressing GFP in retinal POMC cells was inoculated at P0. By 7 dpi, both GFP-expressing amacrine cells (double arrowhead) and GFP-negative cells showed ZIKV infection. Green represents POMC amacrine cells. Orange represents ZIKV. Scale bar, 15 μm.
Figure 10.
Figure 10.
ZIKV infects the visual system in IFNR−/− mouse. A–E, After intraocular inoculation of 4-week-old IFNR−/− mice, ZIKV was identified at 4 dpi in visual system regions (A), including the optic tract (OT), lateral geniculate nucleus (LGN), superior colliculus (SC), and the suprachiasmatic nucleus (SCN). Contralateral to C, the other optic tract also showed ZIKV infection. F, In another IFNR−/− mouse, intramuscular injection into the hind leg led to ZIKV infection of cells in and around the peripheral (per.) nerve innervating the leg. Scale bars: A, 200 μm; B, 60 μm; C, 40 μm; D, 60 μm; E, 40 μm; F, 30 μm.
Figure 11.
Figure 11.
ZIKV-infected cells (red) in optic chiasm colabeled with GFAP. A, Merged image from red ZIKV infections (C) and green immunostaining for GFAP (B) after intraocular inoculation in IFNR−/− mouse, 4 dpi. A–C, Same microscope field. Scale bar, 5 μm.
Figure 12.
Figure 12.
Axonal transport of ZIKV from one brain region to another. After intracortical microinjection (300 nl) into the left cortex (A, F), 4 d later strong infection was found in the contralateral right cortex (B, F) and in the contralateral (contra) (D) and ipsilateral (ipsi) (E) striatum. A few cells were also detected in the amygdala. All these regions are synaptically connected with the cortex. No detectable infection was found in the middle region of the brain (C). F, Composite image with all infected cells drawn from two sections of the same brain. Scale bar, 30 μm.
Figure 13.
Figure 13.
Axonal transport of PRV and ZIKV to contralateral cortex. After comicroinjection (300 nl) of PRV and ZIKV to the left cortex, both viruses are carried by axonal transport to the contralateral right cortex by 3 dpi. A, ZIKV immunoreactivity. Scale bar, 18 μm. B, PRV GFP green reporter expression. C, Merged image showing that some cells are infected only with ZIKV (orange arrows), only with PRV (green arrows), or with both PRV and ZIKV (white arrows).

References

    1. Aliota MT, Caine EA, Walker EC, Larkin KE, Camacho E, Osorio JE (2016) Characterization of lethal zika virus infection in AG129 Mice. PLoS Negl Trop Dis 10:e0004682. 10.1371/journal.pntd.0004682 - DOI - PMC - PubMed
    1. Bell TM, Field EJ, Narang HK (1971) Zika virus infection of the central nervous system of mice. Arch Gesamte Virusforsch 35:183–193. 10.1007/BF01249709 - DOI - PubMed
    1. Brasil P, Pereira JP Jr, Moreira ME, Ribeiro Nogueira RM, Damasceno L, Wakimoto M, Rabello RS, Valderramos SG, Halai UA, Salles TS, Zin AA, Horovitz D, Daltro P, Boechat M, Raja Gabaglia C, Carvalho de Sequeira P, Pilotto JH, Medialdea-Carrera R, Cotrim da Cunha D, Abreu de Carvalho LM, et al. (2016) Zika virus infection in pregnant women in Rio de Janeiro-preliminary report. N Engl J Med 375:2321–2334. 10.1056/NEJMoa1602412 - DOI - PMC - PubMed
    1. Brault JB, Khou C, Basset J, Coquand L, Fraisier V, Frenkiel MP, Goud B, Manuguerra JC, Pardigon N, Baffet AD (2016) Comparative analysis between flaviviruses reveals specific neural stem cell tropism for Zika virus in the mouse developing neocortex. EBioMedicine 10:71–76. 10.1016/j.ebiom.2016.07.018 - DOI - PMC - PubMed
    1. Bray PF, Bale JF, Anderson RE, Kern ER (1981) Progressive neurological disease associated with chronic cytomegalovirus infection. Ann Neurol 9:499–502. 10.1002/ana.410090513 - DOI - PubMed

Publication types

MeSH terms

LinkOut - more resources