. 2016 Dec 7:8:ecurrents.outbreaks.cc09a42586e16dc7dd62813b7ee5d6b6.
doi: 10.1371/currents.outbreaks.cc09a42586e16dc7dd62813b7ee5d6b6.

Social Media as a Sentinel for Disease Surveillance: What Does Sociodemographic Status Have to Do with It?

Affiliations

Social Media as a Sentinel for Disease Surveillance: What Does Sociodemographic Status Have to Do with It?

Elaine O Nsoesie et al. PLoS Curr. .

Abstract

Introduction: Data from social media have been shown to have utility in augmenting traditional approaches to public health surveillance. Quantifying the representativeness of these data is needed for making accurate public health inferences.

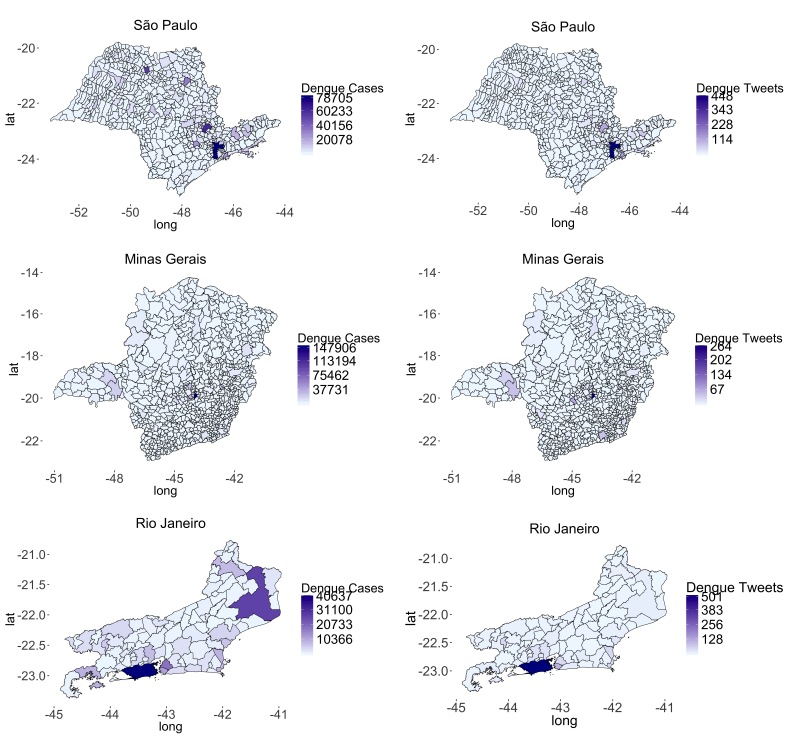
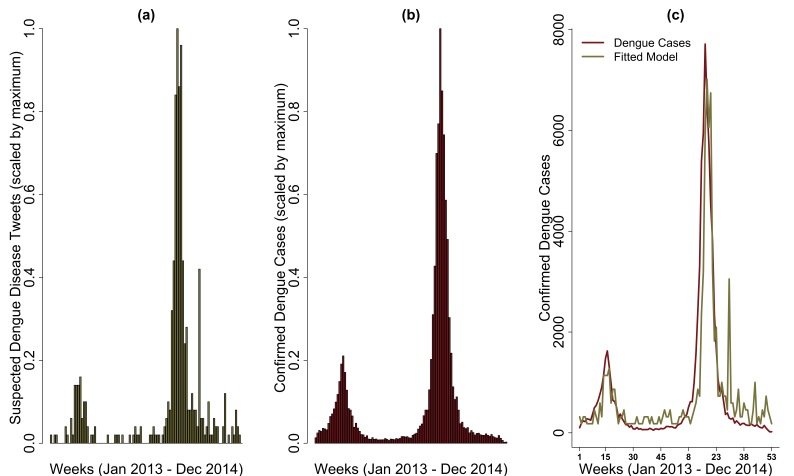
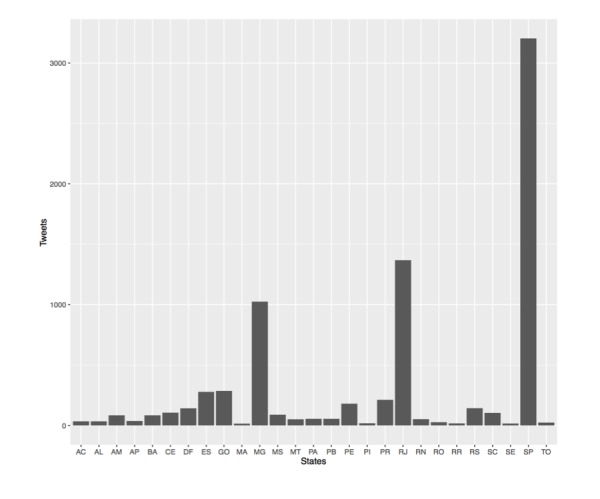
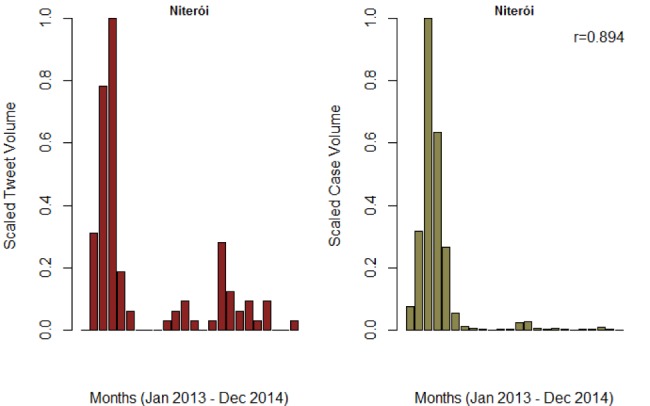
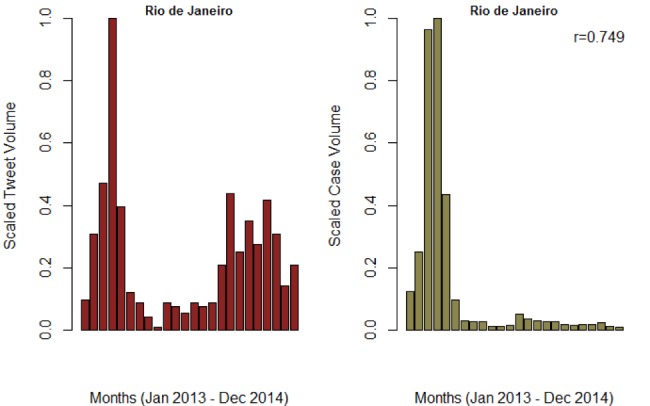
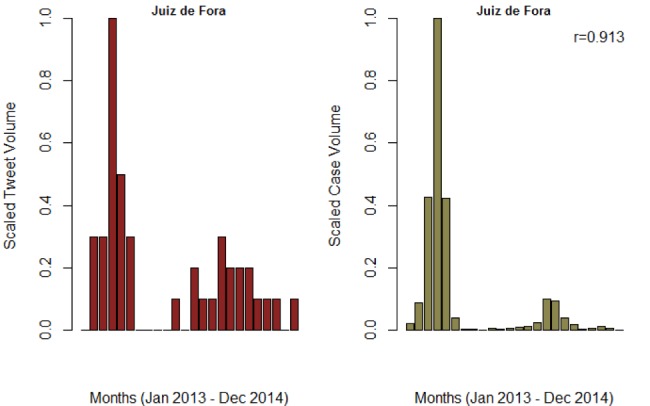
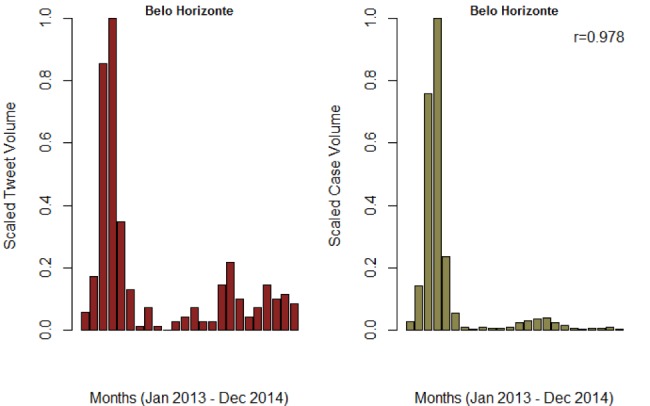
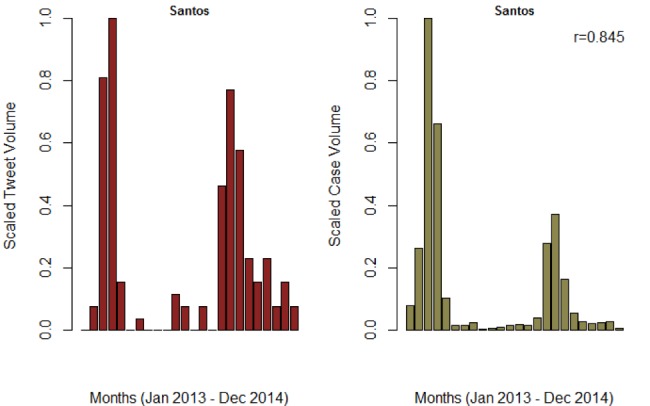
Methods: We applied machine-learning methods to explore spatial and temporal dengue event reporting trends on Twitter relative to confirmed cases, and quantified associations with sociodemographic factors across three Brazilian states (São Paulo, Rio de Janeiro, and Minas Gerais) at the municipality level.

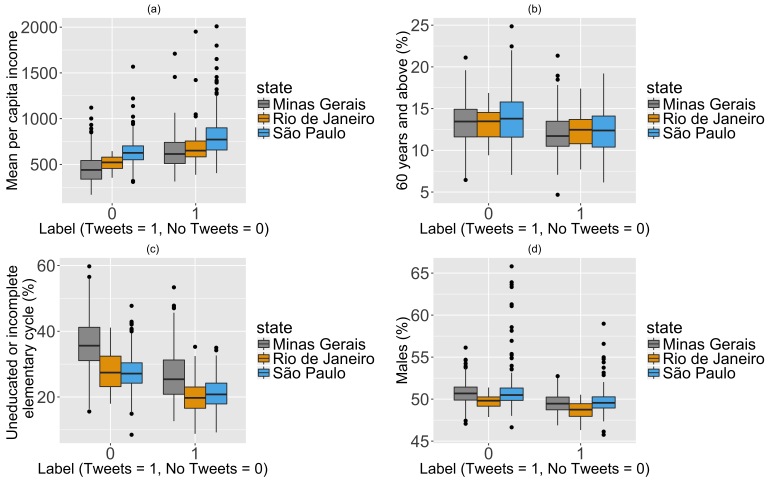
Results: Education and income were positive predictors of dengue reporting on Twitter. In contrast, municipalities with a higher percentage of older adults, and males were less likely to report suspected dengue disease on Twitter. Overall, municipalities with dengue disease tweets had higher mean per capita income and lower proportion of individuals with no primary school education.

Conclusions: These observations highlight the need to understand population representation across locations, age, and racial/ethnic backgrounds in studies using social media data for public health research. Additional data is needed to assess and compare data representativeness across regions in Brazil.

Keywords: Brazil; Twitter; dengue; disease surveillance; infectious disease; social medi; sociodemographic status; socioeconomic factors.


Figures

None
Figure 1. Spatial variation of case and tweet volume by municipality across the states of São Paulo, Minas Gerais, and Rio de Janeiro for 2013-2014.
None
Figure 2. Comparison of the distribution of (a) mean per capita income; (b) percent population 60 years and older; (c) percent population without basic education; and (d) percent population identified as male between municipalities with and without tweets.
None
Figure 3. (a) and (b) are scaled weekly volume of tweets of suspected dengue disease and confirmed dengue cases for the municipality of São Paulo, São Paulo, respectively. (c) univariate linear regression model of weekly dengue cases fitted against weekly suspected dengue disease tweets.
None
Figure SI 1. Number of dengue tweets from each state in Brazil. There was at least one tweet of a suspected dengue case from each of the states with the highest volume originating from São Paulo, Rio de Janeiro and Minas Gerais.
None
Figure SI 2. Trend of monthly tweet volume and confirmed cases for Niteroi municipality in Rio de Janeiro. The estimated Pearson correlation was 0.894 and 0.708 for monthly and weekly reports, respectively.
None
Figure SI 3. Trend of monthly tweet volume and confirmed cases for Rio de Janeiro municipality in Rio de Janeiro. The Pearson correlation wa3s 0.749 and 0.683 for monthly and weekly reports, respectively.
None
Figure SI 4. Trend of monthly tweet volume and confirmed cases for Juiz de Fora municipality in Minas Gerais. The Pearson correlation was 0.913 and 0.524 for monthly and weekly reports, respectively.
None
Figure SI 5. Trend of monthly tweet volume and confirmed cases for Belo Horizonte municipality in Minas Gerais. The Pearson correlation was 0.978 and 0.903 for monthly and weekly reports, respectively.
None
Figure SI 6. Trend of monthly tweet volume and confirmed cases for Santos municipality in São Paulo. The Pearson correlation was 0.845 and 0.689 for monthly and weekly reports, respectively.

References

    1. Kraemer MU, Sinka ME, Duda KA, Mylne AQ, Shearer FM, Barker CM, Moore CG, Carvalho RG, Coelho GE, Van Bortel W, Hendrickx G, Schaffner F, Elyazar IR, Teng HJ, Brady OJ, Messina JP, Pigott DM, Scott TW, Smith DL, Wint GR, Golding N, Hay SI. The global distribution of the arbovirus vectors Aedes aegypti and Ae. albopictus. Elife. 2015 Jun 30;4:e08347. PubMed PMID:26126267. - PMC - PubMed
    1. Bhatt S, Gething PW, Brady OJ, Messina JP, Farlow AW, Moyes CL, Drake JM, Brownstein JS, Hoen AG, Sankoh O, Myers MF, George DB, Jaenisch T, Wint GR, Simmons CP, Scott TW, Farrar JJ, Hay SI. The global distribution and burden of dengue. Nature. 2013 Apr 25;496(7446):504-7. PubMed PMID:23563266. - PMC - PubMed
    1. Horstick O, Tozan Y, Wilder-Smith A. Reviewing dengue: still a neglected tropical disease? PLoS Negl Trop Dis. 2015 Apr 30;9(4):e0003632. PubMed PMID:25928673. - PMC - PubMed
    1. Murray NE, Quam MB, Wilder-Smith A. Epidemiology of dengue: past, present and future prospects. Clin Epidemiol. 2013 Aug 20;5:299-309. PubMed PMID:23990732. - PMC - PubMed
    1. Achee NL, Gould F, Perkins TA, Reiner RC Jr, Morrison AC, Ritchie SA, Gubler DJ, Teyssou R, Scott TW. A critical assessment of vector control for dengue prevention. PLoS Negl Trop Dis. 2015 May 7;9(5):e0003655. PubMed PMID:25951103. - PMC - PubMed

LinkOut - more resources