. 2016 Sep 9;5(12):e1229725.
doi: 10.1080/2162402X.2016.1229725. eCollection 2016.

Transcriptional and metabolic reprogramming induce an inflammatory phenotype in non-medullary thyroid carcinoma-induced macrophages

Affiliations

Transcriptional and metabolic reprogramming induce an inflammatory phenotype in non-medullary thyroid carcinoma-induced macrophages

Rob J W Arts et al. Oncoimmunology. .

Abstract

Tumor-associated macrophages (TAMs) are key components of the tumor microenvironment in non-medullary thyroid cancer (TC), the most common endocrine malignancy. However, little is known regarding the regulation of their function in TC. Transcriptome analysis in a model of TC-induced macrophages identified increased inflammatory characteristics and rewiring of cell metabolism as key functional changes. This functional reprogramming was partly mediated by TC-derived lactate that induced upregulation of cytokine production through an AKT1/mTOR-dependent increase in aerobic glycolysis. This led to epigenetic modifications at the level of histone methylation, and subsequently long-term functional changes. Immunohistochemistry assessment validated the increase in glycolysis enzymes and lactate receptor in TAMs in tissue samples from patients with TC. In conclusion, Akt/mTOR-dependent glycolysis mediates TC-induced reprogramming of TAMs and inflammation, and this may represent a novel therapeutic target in TC.

Keywords: Cytokines; epigenetics; immunometabolism; lactate; thyroid cancer; tumor-associated macrophages.


Figures
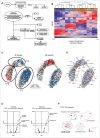
Figure 1.
Figure 1.
Transcriptome analysis of TC-induced macrophages. (A) Scheme outlining the experimental setup (upper scheme) and bioinformatics analysis (lower scheme). (B) HC map of the top 1,000 variable genes between TC-induced macrophages and RPMI controls. (C) Network visualization of gene-centered CRA (Pearson correlation ≥ 0.7). FC over mean of all conditions is mapped onto the network for TC-induced macrophages (4 h, left network; 24 h, right network). (D) Volcano plots of normalized enrichment scores (NES) and enrichment p-values based on GSEA using Hallmark pathway gene sets (MSigDB, Broad Institute). Data are shown for TPC1 co-cultured macrophages (4 h and 24 h). Dark (NES ≥ 1; p-value ≤ 0.05) and light (NES ≥ 1; p-value > 0.05, ≤ 0.1) red circles show gene sets positively enriched. Dark and light blue circles show gene sets depleted (NES ≤ −1). (E) Hallmark and reactome pathway genes (MSigDB, Broad institute) related to PI3K/AKT/MTOR and glycolysis mapped onto the CRA network (orange nodes). (F) Network visualization of GOEA of genes derived from the “TPC1 co-cultured (24 h) vs. mean all conditions” comparison (FC: ≥ 1; present in CRA network) using BiNGO and EnrichmentMap. Red nodes represent the enriched GO-terms, node size and color represents corresponding FDR-adjusted enrichment p-values (p-value ≤ 0.05). See also Fig. S1.
Figure 2.
Figure 2.
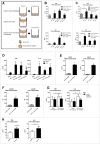
TC-induced macrophages have a proinflammatory phenotype. (A) Outline of the culturing methods. (B) Monocytes were incubated for 24 h with TC cells in a trans-well system and restimulated with LPS for 24 h (n = 7). (C) TAMs derived from co-culture with TPC1 and two glioblastoma cell lines were restimulated with LPS for 24 h (n = 4). (D) Medium from three thyroid cell lines was added to human monocytes for 24 h and subsequently stimulated with RPMI or LPS for 24 h (n = 4). (E & F) Lactate and VEGF were determined in naïve macrophage and tumor medium (n = 6). (G) A lactate receptor antagonist was added to the culture system. (Mean ± SEM, n = 5, *p < 0.05, by Wilcoxon signed-rank test). (H) Monocytes were incubated with 1 µM of lactic acid for 24 h and restimulated with LPS for 24 h (n = 8). Data shown as Mean ± SEM, *p < 0.05, **p < 0.01 by Wilcoxon signed-rank test.
Figure 3.
Figure 3.
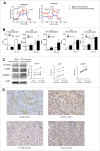
Metabolism of TC-induced macrophages is changed. (A) Extracellular acidification rate (ECAR) and oxygen consumption rate (OCR) from TC-induced macrophages and naive macrophages were determined after TC-induced macrophages were relieved for 24 h from the TPC1 cells (n = 4). (B) Inhibitors of mTOR (rapamycin), pentose phosphate pathway (6-AN), glutamine metabolism (BPTES), fatty acid β oxidation (etomoxir), and complex V ATP synthase (oligomycin) were added to the culture system and cells were restimulated for 24 h with LPS (n = 4). (C) Monocytes were incubated for 24 h with TPC1 cells, after 24 h rest cells were lysed and p-mTOR, p-S6K, and p-4EBP1 induction were determined. (D) Immunohistochemical analysis of PFKFB3, PKM2, and GPR81 in CD68-positive TAMs. Results are representative of stained FFPE tissue material from six anaplastic TC patients. Data shown as Mean ± SEM, *p < 0.05, by Wilcoxon signed-rank test.
Figure 4.
Figure 4.
The proinflammatory phenotype is epigenetically regulated. (A) Outline of the culturing methods. (B) Monocytes were co-incubated with thyroid tumor cell lines for 24 h. After 1 day additional rest they were restimulated with LPS for 24 h (n = 5). (C) MTA, an inhibitor of histone methylation was added to the culture system and cells were restimulated for 24 h with LPS (n = 6). (D & E) Monocytes were incubated for 24 h with TPC1 cells, after 24 h rest DNA was isolated to determine H3K4me3 (D) and H3K9me3 (E) expression at the promoter site of IL6 and TNFA (n = 6, n = 5). Data shown as Mean ± SEM, *p < 0.05 by Wilcoxon signed-rank test.
Figure 5.
Figure 5.
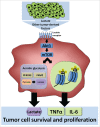
Soluble tumor-derived signals change the phenotype of the tumor-associated macrophage, by induction of the mTOR pathway and glycolysis, and epigenetic changes.

References

    1. Mantovani A, Allavena P, Sica A, Balkwill F. Cancer-related inflammation. Nature 2008; 454:436-44; PMID:18650914; http://dx.doi.org/10.1038/nature07205 - DOI - PubMed
    1. Noy R, Pollard JW. Tumor-associated macrophages: from mechanisms to therapy. Immunity 2014; 41:49-61; PMID:25035953; http://dx.doi.org/10.1016/j.immuni.2014.06.010 - DOI - PMC - PubMed
    1. Colegio OR, Chu NQ, Szabo AL, Chu T, Rhebergen AM, Jairam V, Cyrus N, Brokowski CE, Eisenbarth SC, Phillips GM et al.. Functional polarization of tumour-associated macrophages by tumour-derived lactic acid. Nature 2014; 513:559-63; PMID:25043024; http://dx.doi.org/10.1038/nature13490 - DOI - PMC - PubMed
    1. Sica A, Mantovani A. Macrophage plasticity and polarization: in vivo veritas. J Clin Investig 2012; 122:787-95; PMID:22378047; http://dx.doi.org/10.1172/JCI59643 - DOI - PMC - PubMed
    1. Davies L, Welch HG. Current thyroid cancer trends in the United States. JAMA Otolaryngol Head Neck Surg 2014; 140:317-22; PMID:24557566; http://dx.doi.org/10.1001/jamaoto.2014.1 - DOI - PubMed

Publication types