. 2016 Oct 7;5(12):e1240859.
doi: 10.1080/2162402X.2016.1240859. eCollection 2016.

Identification of a tumor-reactive T-cell repertoire in the immune infiltrate of patients with resectable pancreatic ductal adenocarcinoma

Affiliations

Identification of a tumor-reactive T-cell repertoire in the immune infiltrate of patients with resectable pancreatic ductal adenocarcinoma

Isabel Poschke et al. Oncoimmunology. .

Abstract

Purpose: The devastating prognosis of patients with resectable pancreatic ductal adenocarcinoma (PDA) presents an urgent need for the development of therapeutic strategies targeting disseminated tumor cells. Until now, T-cell therapy has been scarcely pursued in PDA, due to the prevailing view that it represents a poorly immunogenic tumor.

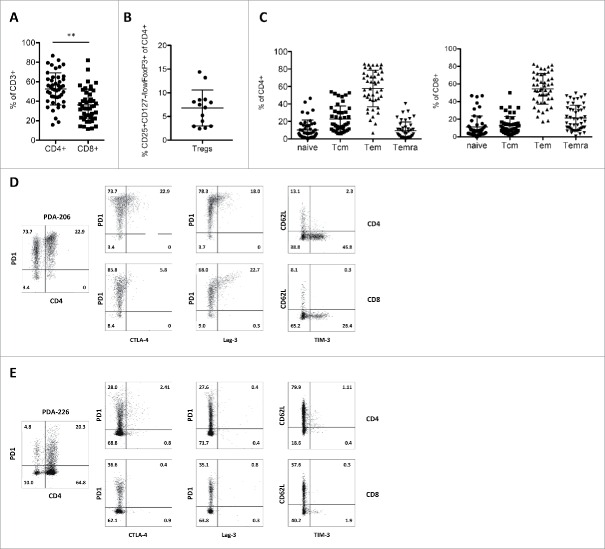
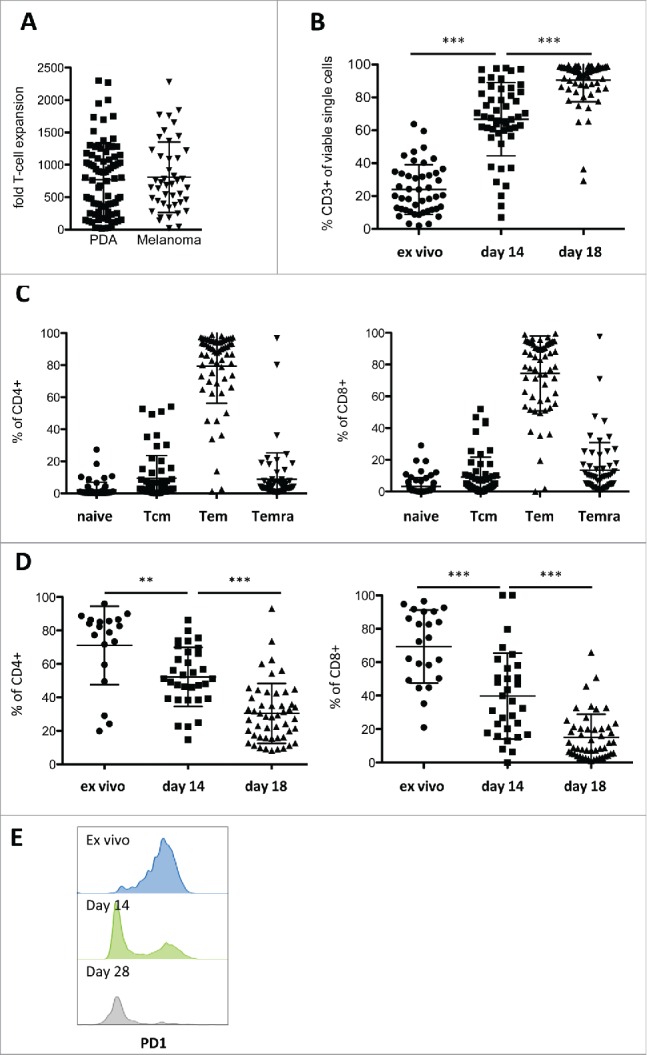
Experimental design: We systematically analyzed T-cell infiltrates in tumor biopsies from 127 patients with resectable PDA by means of immunohistochemistry, flow cytometry, T-cell receptor (TCR) deep-sequencing and functional analysis of in vitro expanded T-cell cultures. Parallel studies were performed on tumor-infiltrating lymphocytes (TIL) from 44 patients with metastatic melanoma.

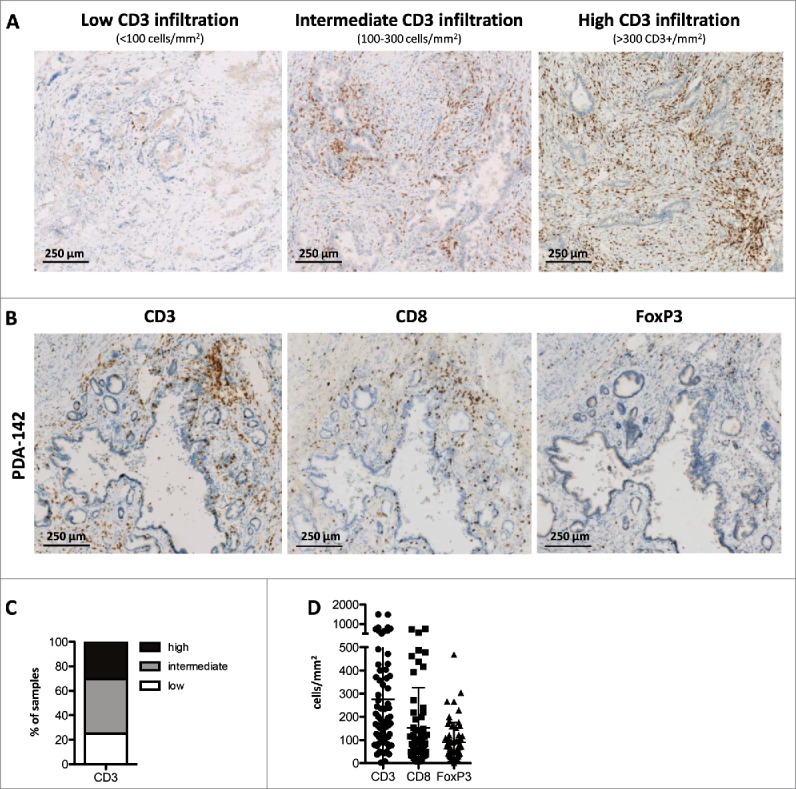
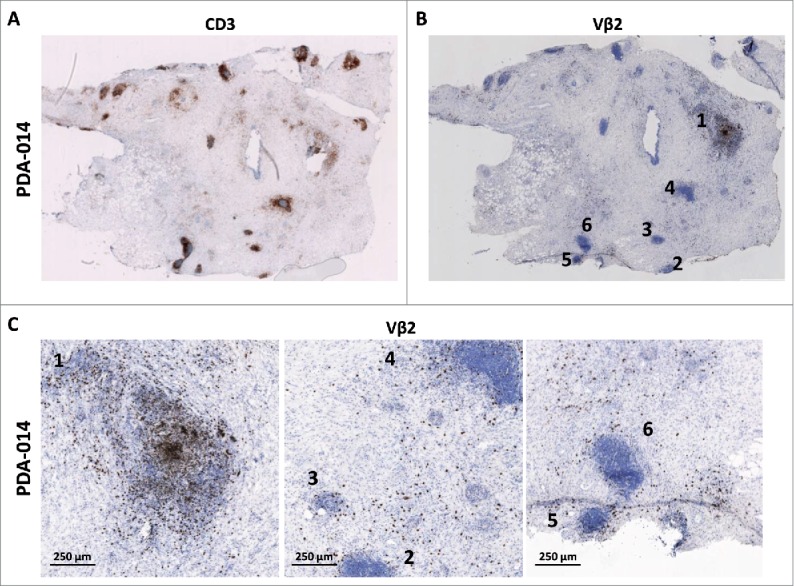
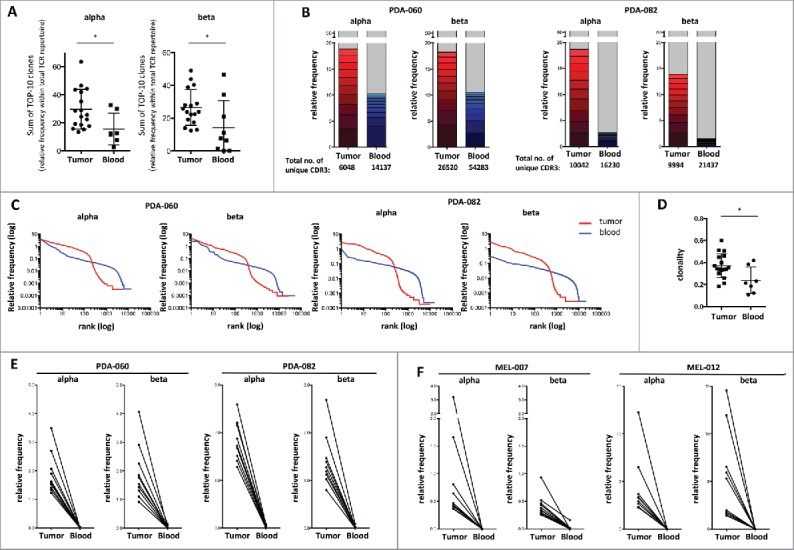
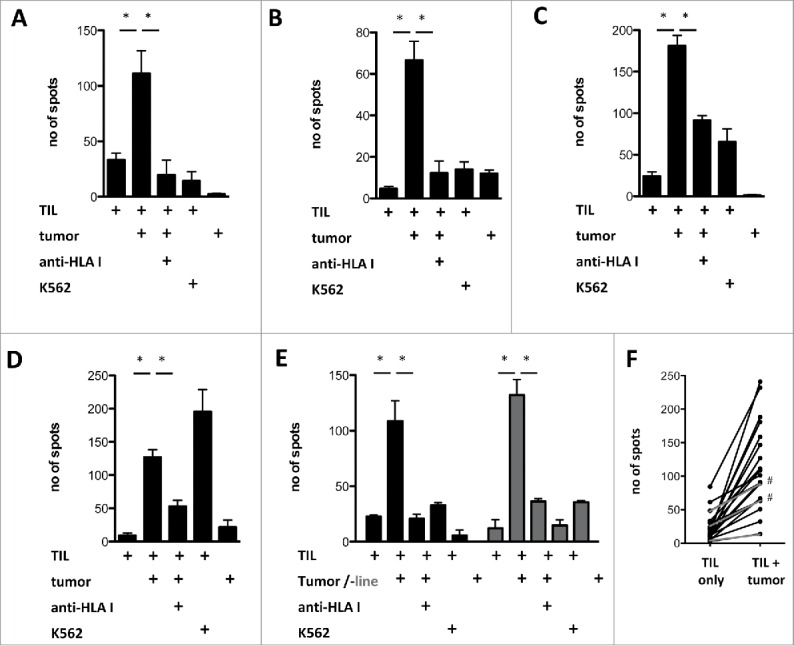
Results: Prominent T-cell infiltrates, as well as tertiary lymphoid structures harboring proliferating T-cells, were detected in the vast majority of biopsies from PDA patients. The notion that the tumor is a site of local T-cell expansion was strengthened by TCR deep-sequencing, revealing that the T-cell repertoire in the tumor is dominated by highly frequent CDR3 sequences that can be up to 10,000-fold enriched in tumor as compared to peripheral blood. In fact, TCR repertoire composition in PDA resembled that in melanoma. Moreover, in vitro expansion of TILs was equally efficient for PDA and melanoma, resulting in T-cell cultures displaying HLA class I-restricted reactivity against autologous tumor cells.

Conclusions: The tumor-infiltrating T-cell response in PDA shows striking similarity to that in melanoma, where adoptive T-cell therapy has significant therapeutic impact. Our findings indicate that T-cell-based therapies may be used to counter disease recurrence in patients with resectable PDA.

Keywords: Adoptive T-cell therapy; T-cell receptor (TCR) repertoire; pancreatic ductal adenocarcinoma; tertiary lymphoid structures; tumor-infiltrating lymphocytes.


Figures

Figure 1.
Figure 1.
Immune infiltration patterns in primary resectable PDA. (A) Representative examples of PDA tumors showing low (left), intermediate (middle) or high (right) infiltration of CD3+ T-cells; scale bars denote 250 μm; data is representative of 72 patients analyzed. (B) Serial sections of a PDA tumor stained for total CD3+ T-cells (left), CD8+ cytotoxic T-cells (middle) and FoxP3+ regulatory T-cells (right); scale bars denote 250 μm. (C) Proportion of patients (n = 72) displaying low, intermediate or high CD3+ T-cell infiltration (mean CD3 count/mm2 tumor area <100, 100–300 and >300, respectively). (D) Number of CD3+, CD8+ and FoxP3+ T-cells/mm2 tumor area in PDA patients (n≥60 ). Notably, tumor area is defined as the total tumor tissue, including the stromal and fibrotic areas, but excluding surrounding normal pancreatic tissue and chronically inflamed tissue areas that are not directly associated with the tumor.
Figure 2.
Figure 2.
Evidence of clonal expansion in tertiary lymphoid structures (TLS). (A) Example of a tumor biopsy with many TLS as visualized by CD3 staining. (B) Vβ2-specific staining on a serial section of the tumor shown in (A). (C) Magnification of three areas of the aforementioned tumor, showing that Vβ2-positive T-cells are not enriched in TLS other than #1 and are diffusely spread throughout the tumor tissue. Numbers indicate the TLS as denoted in panel (B). Scale bars represent 250 μm. Data shown is representative of 33 tumors analyzed.
Figure 3.
Figure 3.
Evidence of highly enriched T-cell clones in PDA and melanoma on basis of TCR deep-sequencing. (A) Sum of the 10 largest clones/unique CDR3 sequences (relative frequency) identified in tumor (n = 17) and blood samples (n = 7) of PDAC patients by deep-sequencing of TCR-α and -β chains. (B) Relative frequency of the 10 largest clones (detected by TCR-α and -β chain sequencing) in tumor (red) and blood (blue) samples of two representative PDA patients versus all remaining clones (gray), where 100% represents the total number of CDR3 reads as given below the bars. (C) All unique CDR3 sequences detected in tumor (red) or blood (blue) of the two aforementioned PDA patients sorted according to their frequency within the sample, showing that larger clones (left) dominate in tumor, whereas smaller clones dominate in the blood (right). (D) Clonality of the TCR-β repertoire in tumor (n = 17) and blood (n = 5) of PDA patients, showing lower TCR diversity in tumor-infiltrating T-cells. Values can range from 0 (maximum diversity) to 1 (minimal diversity). (E) Size of the 10 largest TCR clones (TCR-α and -β sequencing) detected in the tumor of the two aforementioned PDA patients in tumor vs. blood. (E) Size of the 10 largest TCR clones (TCR-α and -β sequencing) detected in the tumor of two representative melanoma patients in tumor versus blood (n = 7 tumor and n = 5 blood samples were analyzed).
Figure 4.
Figure 4.
Phenotype of PDA-infiltrating T-cell subsets. Flow cytometric evaluation of (A) the frequency of CD4+ and CD8+ TILs (n = 46) (B) the frequency of regulatory T-cells in CD4+ TILs (n = 14) (C) the distribution of memory cell subsets (naive – CD45RA+/CCR7+; Tcm – CD45RACCR7+, Tem – CD45RACCR7, Temra – CD45RA+CCR7) within tumor-infiltrating CD4+ (left panel) and CD8+ (right panel) T-cells (n = 38). (D–E) Representative flow cytometry data of two primary PDA TIL isolates (totally ≥ 20 PDA patients were analyzed), showing expression of PD1 on CD4+ and CD4 T-cells (left panel), as well as co-expression patterns of activation and exhaustion markers on CD4+ (top) and CD8+ (bottom) TILs.
Figure 5.
Figure 5.
In vitro expansion of PDA-infiltrating lymphocytes. (A) Fold expansion of TIL cultures derived from PDA (n = 86) and melanoma (n = 44) patients during the two-week rapid expansion protocol. (B) Frequency of CD3+ TILs before start of culture (ex vivo, primary isolate), after pre-expansion in 24-well plates (day 14) and after rapid expansion (day 28) (n ≥ 45 ), as measured by flow cytometry. (C) Distribution of memory cell subsets (naive – CD45RA+/CCR7+; Tcm – CD45RACCR7+; Tem – CD45RACCR7; Temra – CD45RA+CCR7) after expansion in CD4+ (left panel) and CD8+ (right panel) T-cells (n = 60), measured by flow cytometry. (D) Expression of the negative regulatory marker PD-1 on CD4+ (left panel) and CD8+ (right panel) T-cells before start of culture (ex vivo), after pre-expansion in 24-well plates (day 14) and after rapid expansion (day 28) shown as percent PD1+ cells (n ≥19 ). (E) PD-1 fluorescence in T-cells of a representative culture ex vivo, on day 14 and day 28, measured by flow cytometry.
Figure 6.
Figure 6.
Antitumor reactivity of in vitro expanded PDA TIL. (A–E) Reactivity of in vitro expanded PDA TIL against autologous xenograft tumors (tumor) or a xenograft-derived cell line (“tumor line,” gray bars) measured by IFNγ Elispot, with or without pre-incubation of the tumor cell targets with pan-HLA-class I binding antibody W6/32 (anti-HLA I). (F) Of the 20 expanded TIL cultures for which autologous tumors were available, 17 displayed antitumor reactivity (black lines), whereas 3 did not show a significantly increased spot-count in response to autologous tumor targets (gray lines). In two responding cultures, no significant reduction of IFNγ production was achieved by pre-incubation with the MHC I blocking antibody (marked with #).

References

    1. Sharma P, Allison JP. Immune checkpoint targeting in cancer therapy: toward combination strategies with curative potential. Cell 2015; 161:205-14; PMID:25860605; http://dx.doi.org/10.1016/j.cell.2015.03.030 - DOI - PMC - PubMed
    1. Topalian SL, Drake CG, Pardoll DM. Immune checkpoint blockade: a common denominator approach to cancer therapy. Cancer Cell 2015; 27:450-61; PMID:25858804; http://dx.doi.org/10.1016/j.ccell.2015.03.001 - DOI - PMC - PubMed
    1. Gillen S, Schuster T, Meyer Zum Buschenfelde C, Friess H, Kleeff J. Preoperative/neoadjuvant therapy in pancreatic cancer: a systematic review and meta-analysis of response and resection percentages. PLoS Med 2010; 7:e1000267; PMID:20422030; http://dx.doi.org/10.1371/journal.pmed.1000267 - DOI - PMC - PubMed
    1. Conroy T, Desseigne F, Ychou M, Bouche O, Guimbaud R, Becouarn Y, Adenis A, Raoul JL, Gourgou-Bourgade S, de la Fouchardière C et al.. FOLFIRINOX versus gemcitabine for metastatic pancreatic cancer. N Engl J Med 2011; 364:1817-25; PMID:21561347; http://dx.doi.org/10.1056/NEJMoa1011923 - DOI - PubMed
    1. Hartwig W, Werner J, Jager D, Debus J, Buchler MW. Improvement of surgical results for pancreatic cancer. Lancet Oncol 2013; 14:e476-85; PMID:24079875; http://dx.doi.org/10.1016/S1470-2045(13)70172-4 - DOI - PubMed

Publication types