. 2016 Oct 20;5(12):e1247135.
doi: 10.1080/2162402X.2016.1247135. eCollection 2016.

The expression profiles and regulation of PD-L1 in tumor-induced myeloid-derived suppressor cells

Affiliations

The expression profiles and regulation of PD-L1 in tumor-induced myeloid-derived suppressor cells

Chunwan Lu et al. Oncoimmunology. .

Abstract

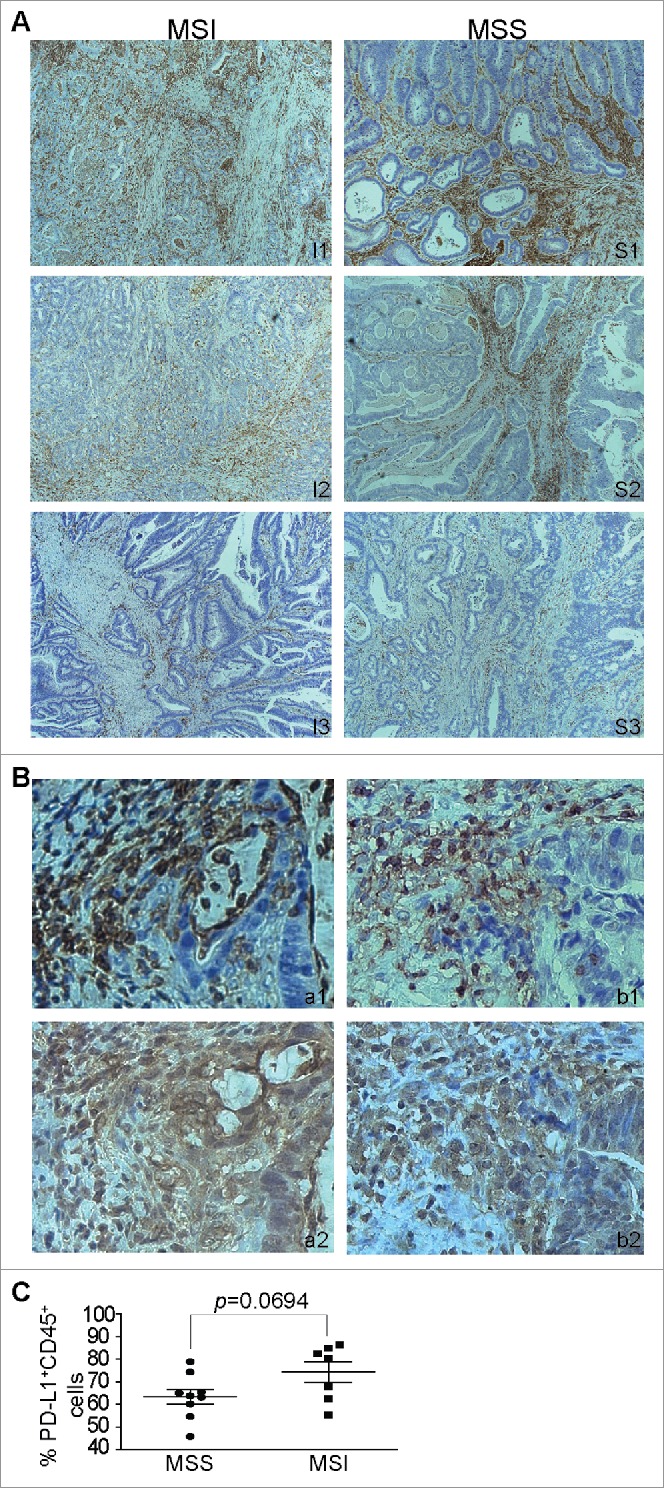
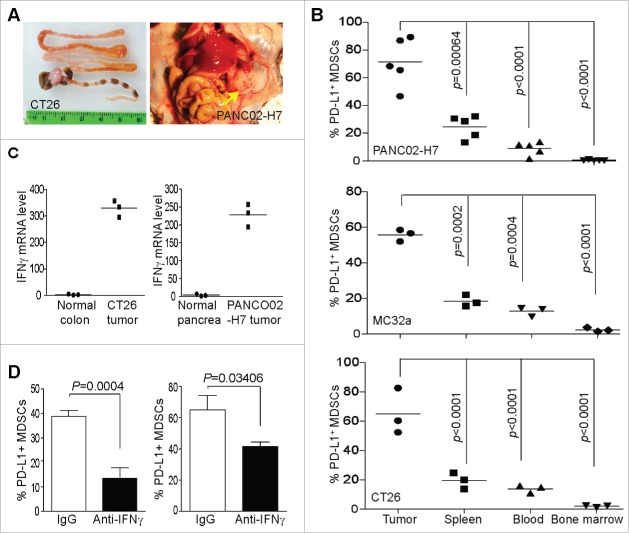
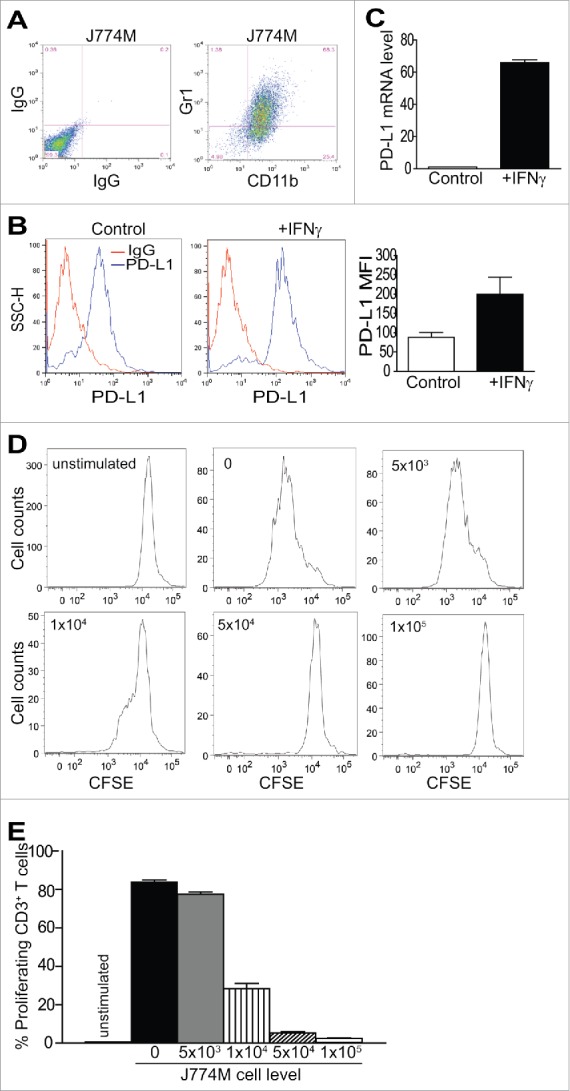
Programmed death-ligand 1 (PD-L1) is an inhibitory ligand that binds to PD-1 to suppress T cell activation. PD-L1 is constitutively expressed and inducible in tumor cells, but the expression profiles and regulatory mechanism of PD-L1 in myeloid-derived suppressor cells (MDSCs) are largely unknown. We report that PD-L1 is abundantly expressed in tumor-infiltrating leukocytes in human patients with both microsatellite instable and microsatellite stable colon cancer. About 60% CD11b+CD33+HLA-DR- MDSCs from peripheral blood of human colon cancer patients are PD-L1+. PD-L1+ MDSCs are also significantly higher in tumor-bearing mice than in tumor-free mice. Interestingly, the highest PD-L1+ MDSCs were observed in the tumor microenvironment in which 56-71% tumor-infiltrating MDSCs are PD-L1+in vivo. In contrast, PD-L1+ MDSCs are significantly less in secondary lymphoid organs and peripheral blood as compared to the tumor tissues, whereas bone marrow MDSCs are essentially PD-L1- in tumor-bearing mice. IFNγ is highly expressed in cells of the tumor tissues and IFNγ neutralization significantly decreased PD-L1+ MDSCs in the tumor microenvironment in vivo. However, IFNγ-activated pSTAT1 does not bind to the cd274 promoter in MDSCs. Instead, pSTAT1 activates expression of IRF1, IRF5, IRF7 and IRF8 in MDSCs, and only pSTAT1-activated IRF1 binds to a unique IRF-binding sequence element in vitro and chromatin in vivo in the cd274 promoter to activate PD-L1 transcription. Our data determine that PD-L1 is highly expressed in tumor-infiltrating MDSCs and in a lesser degree in lymphoid organs, and the pSTAT1-IRF1 axis regulates PD-L1 expression in MDSCs.

Keywords: IFNγ; MDSCs; MSI colon cancer; MSS colon cancer; PD-L1; T cells.


Figures

Figure 1.
Figure 1.
PD-L1 protein level in human colon carcinoma tissues. (A) Human colon carcinoma tissues were stained with anti-human CD45 (A1a–A4a and A1b–A4b) and anti-human PD-L1 (B1a–B4a and B1b–B4b) monoclonal antibodies, respectively. Brown color indicates CD45 and PD-L1 protein levels, with counterstaining by hematoxylin in blue. Shown are representative images; A1 & B1: colon adenoma; A2 & B2: colon adenocarcinoma; A3 & B3: Lymph node metastases; A4 & B4: Liver metastases. a: images of whole tissue discs. b: amplified area as shown in a. Yellow arrows indicate CD45-positive cells and red arrows point PD-L1-positive cells. Human tonsil (C1a & C1b) and adrenal tumor (D) tissue were used as positive controls of PD-L1 protein. G: Germinal center. Black arrow indicates lymphoid cells. (B) Quantification of PD-L1+CD45+ cells in human colon carcinoma. PD-L1+ cells (B1a-B4a & B1b-B4b) of the CD45+ cell (A1a-A4a and A1b-A4b) in adenoma (n = 13), adenocarcinoma (n = 15), LN metastases (n = 6) and liver metastases (n = 7) were counted and expressed as % PD-L1+ cells/CD45+ cells per tumor tissue.
Figure 2.
Figure 2.
Leukocyte infiltration patterns in human MSI and MSS colon carcinoma tissues. (A) MSI and MSS human colon carcinoma tissues were stained with anti-human CD45 antibody. Brown color indicates CD45 staining, with nuclei counterstaining by hematoxylin in blue. I:1–3: tumor tissues from three patients with MSI colon cancer. S1–3: tumor tissues from three patients with MSS colon cancer. Shown are representative images in low-power magnification. (B) High-power magnification of images showing CD45 (a1 and b1) and PD-L1 (a2 and b2) staining levels in MSI (a) and MSS (b) colon cancer tissues, respectively. (C) Quantification of PD-L1+CD45+ cells in MSI (n = 7) and MSS (n = 9) colon carcinoma tissues. PD-L1+ cells of the CD45+ cells as shown in (A) were counted and expressed as percentage of PD-L1+ cells/CD45+ cells.
Figure 3.
Figure 3.
PD-L1 expression in MDSCs of human colon cancer patients. (A) Peripheral blood specimens were obtained from consented healthy donors (n = 10) and colon cancer patients (n = 10). White blood cells were isolated and stained with anti-human CD11b, anti-human CD33, anti-human HLA-DR and anti-human PD-L1 mAbs. HLA-DR cells were gated out and analyzed for CD11b+CD33+ cells (top panel). HLA-DR-CD11b+CD33+ cells were then gated and analyzed for PD-L1+ cells (bottom panel). (B–E) White bloods cells from healthy donors (n = 10) and colon cancer patients (n = 10) as shown in (A) were stained with anti-human CD11c and anti-human PD-L1 (B), anti-human CD3 and anti-human PD-L1 (C), anti-human CD19 and anti-human PD-L1 (D), anti-human CD337 and anti-human PD-L1 mAbs and analyzed by flow cytometry. % PD-L1+ cells in the indicated subsets of immune cells were quantified. Significance was determined by two-sided Student's t-test.
Figure 4.
Figure 4.
PD-L1 expression in MDSCs of mice with spontaneous colon cancer. (A) C57BL/6 mice were treated with AOM and DSS as described in the materials and methods. Shown are tumor-bearing colons with tumor nodules indicated by a red arrow (left panel). The colon tissue was prepared as a SWISS roll and sectioned. The sections were stained with H&E. Shown are normal colon mucosa (the second panel from the left), adenoma (the third panel from the left) and adenomacarcinoma (right panel). (B) Spleens were collected from tumor-free (TF) control mice (n = 9) and tumor-bearing mice as shown in A (n = 9) and prepared for single cells. The cells were stained with combinations of (1) anti-mouse CD11b, anti-mouse Gr1 and anti-mouse PD-L1, (2) anti-mouse CD11b, anti-mouse Ly6G and anti-mouse PD-L1 and (3) anti-mouse CD11b, anti-mouse Ly6C and anti-mouse PD-L1 mAbs. Cells were analyzed by flow cytometry. PD-L1+ cells in CD11b+Gr1+, CD11b+Ly6G+, CD11b+Ly6C+ cells were quantified and shown as indicated. C–E. Spleen cells from TF (n = 9) and TB (n = 9) mice as shown in (A) were stained with anti-mouse CD11c and anti-human PD-L1 (C), anti-mouse CD3, anti-mouse CD19, and anti-mouse PD-L1 (D), anti-mouse NK1.1 and anti-mouse PD-L1 (E) mAbs and analyzed by flow cytometry. % PD-L1+ cells in the indicated subsets of immune cells were quantified. Significance was determined by two-sided Student's t-test.
Figure 5.
Figure 5.
MDSC distribution in tissues of tumor-bearing mice. (A) Colon carcinoma CT26 cells were surgically transplanted to the cecal wall of BALB/c mice and shown is a representative tumor-bearing colon with the tumor nodule indicated by a red arrow (left panel). Right panel: Pancreatic PANC02-H7 cells were surgically transplanted to pancreas of C57BL/6 mice. Shown is a representative tumor-bearing mice with a single-tumor nodule in the pancreas indicated by a yellow arrow, right panel). (B) The CT26 orthotopic tumors (n = 3) and PANC02-H7 orthotopic tumors (n = 5) as shown in (A) and the MC32a orthotopic tumors (n = 3) were collected. The tumor tissues were digested with collagenase solution to make single cells. Spleens, blood and bone marrow were also collected from these tumor-bearing mice. Cells were stained with CD11b-, Gr1- and PD-L1-specific mAbs and analyzed by flow cytometry for CD11b+Gr1+PD-L1+ cells. Significance was determined by two-sided Student's t-test. (C) The tumor nodules as shown in (A) were dissected and prepared for total RNA. Total RNA was also prepared from colon and pancreas of tumor-free mice. The RNA samples were analyzed by qPCR for IFNγ mRNA level with β-actin as normalization controls. (D) CT26 tumor-bearing (left panel) and PANC02-H7 tumor-bearing (right panel) as shown in (A) were treated with IgG or IFNγ neutralization mAb for 10 d (200 ug/mouse, i.p.). Tumor tissues were analyzed for PD-L1+ MDSCs (CD11b+Gr1+ cells) as in (B). Column: mean; Bar: SD.
Figure 6.
Figure 6.
Establishment of a stable MDSC-like cell lines. (A) CD11b+Gr1+ cells were sorted from J774 myeloid cell line and establish a CD11b+Gr1+ stable MDSC-like cells lines termed J774M. (B) J774M cells were treated with IFNγ for approximately 20 h. Cells were then stained with PD-L1-specific mAb and analyzed by flow cytometry. The MFI of PD-L1 was quantified and presented at the right panel. Column: mean, Bar: SD. (C) J774M cells were treated with IFNγ as in B and analyzed by qPCR for PD-L1 mRNA level with β-actin as internal normalization control. (D) CD3+ T cells were purified from BALB/c mouse spleens and labeled with CFSE. Cells were then seeded in anti-CD3 and anti-CD28-coated 96-well plate (1 × 10⁵ cells/well). At the same time, J774M cells were added to the culture at the indicated cell density (top left corner) and the cell mixture were cultured for another 72 h. Cells were collected and stained with CD11b-specific mAb. CD11b−/− cells were gated and analyzed for CFSE intensity. (E) Quantification of CD3+ T cell proliferation as determined by CFSE intensity as shown in (D). Column: mean; Bar: SD.
Figure 7.
Figure 7.
IRF1 directly binds to the cd274 promoter region to activate cd274 transcription in MDSCs. (A) The mouse cd274 promoter DNA sequence (−4,000 to +1,000 relative to cd274 transcription start site) was exported from the mouse genomic database and analyzed for potential IRF-binding elements. Shown is the cd274 promoter structure with three potential IRF-binding consensus sequences (bold italic). (B) J774M cells were treated with IFNγ for 24 h and lysed for nuclear extract preparation. The nuclear extracts were incubated with 32P-labeled probes as shown in the top panel. The DNA-protein complexes were analyzed by polyacrylamide gel electrophoresis. IgG and anti-IRF1 antibody were used to identify the IRF1-DNA complexes. (C) J774M cells were treated with IFNγ for 24 h as in (B). Chromatin was then prepared from the treated cells and analyzed by ChIP with an IRF1-specific antibody. The immunoprecipitated chromatin fragments were then analyzed by qPCR with primers spanning from −4,000 to +1,000 relative to the cd274 promoter region. (D) J774M cells were transfected with scramble and IRF1-specific siRNA. Cells were then either untreated or treated with IFNγ for 24 h and analyzed for IRF1 and PD-L1 mRNA levels by qPCR with β-actin as internal normalization controls.

References

    1. Sun L, St Leger AJ, Yu CR, He C, Mahdi RM, Chan CC, Wang H, Morse HC 3rd, Egwuagu CE. Interferon Regulator Factor 8 (IRF8) Limits Ocular Pathology during HSV-1 Infection by Restraining the Activation and Expansion of CD8+ T Cells. PLoS One 2016; 11:e0155420; PMID:27171004; http://dx.doi.org/10.1371/journal.pone.0155420 - DOI - PMC - PubMed
    1. Simon S, Vignard V, Florenceau L, Dreno B, Khammari A, Lang F, Labarriere N. PD-1 expression conditions T cell avidity within an antigen-specific repertoire. Oncoimmunology 2016; 5:e1104448; PMID:26942093; http://dx.doi.org/10.1080/2162402X.2015.1104448 - DOI - PMC - PubMed
    1. Lim TS, Chew V, Sieow JL, Goh S, Yeong JP, Soon AL, Ricciardi-Castagnoli P. PD-1 expression on dendritic cells suppresses CD8 T cell function and antitumor immunity. Oncoimmunology 2016; 5:e1085146; PMID:27141339; http://dx.doi.org/10.1080/2162402X.2015.1085146 - DOI - PMC - PubMed
    1. Rosenbaum MW, Bledsoe JR, Morales-Oyarvide V, Huynh TG, Mino-Kenudson M. PD-L1 expression in colorectal cancer is associated with microsatellite instability, BRAF mutation, medullary morphology and cytotoxic tumor-infiltrating lymphocytes. Mod Pathol 2016; 29:1104-12; PMID:27198569; http://dx.doi.org/10.1038/modpathol - DOI - PubMed
    1. Dunne PD, McArt DG, O'Reilly PG, Coleman HG, Allen WL, Loughrey M, Van Schaeybroeck S, McDade S, Salto-Tellez M, Longley DB et al.. Immune-derived PD-L1 gene expression defines a subgroup of stage II/III colorectal cancer patients with favorable prognosis that may be harmed by adjuvant chemotherapy. Cancer Immunol Res 2016; 4:582-91; PMID:27197062; http://dx.doi.org/10.1158/2326-6066.CIR-15-0302 - DOI - PubMed

Publication types