. 2016 Dec 30:14:18-27.
doi: 10.1016/j.nicl.2016.12.030. eCollection 2017.

Novel surface features for automated detection of focal cortical dysplasias in paediatric epilepsy

Affiliations

Novel surface features for automated detection of focal cortical dysplasias in paediatric epilepsy

Sophie Adler et al. Neuroimage Clin. .

Abstract

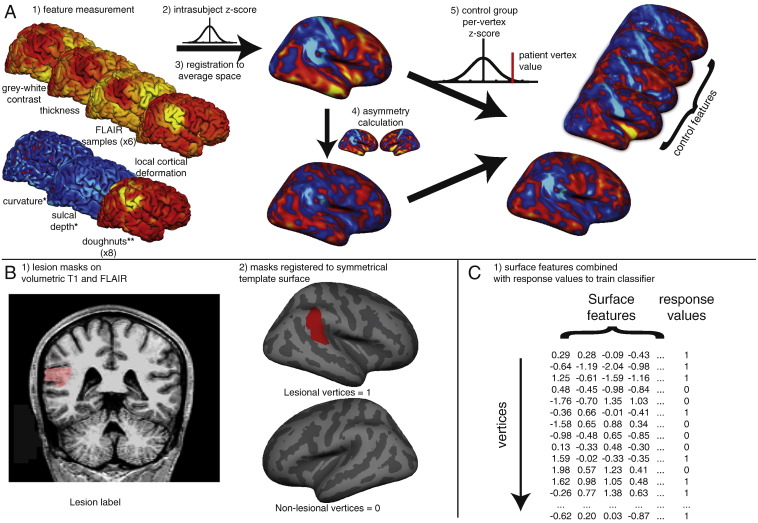
Focal cortical dysplasia is a congenital abnormality of cortical development and the leading cause of surgically remediable drug-resistant epilepsy in children. Post-surgical outcome is improved by presurgical lesion detection on structural MRI. Automated computational techniques have improved detection of focal cortical dysplasias in adults but have not yet been effective when applied to developing brains. There is therefore a need to develop reliable and sensitive methods to address the particular challenges of a paediatric cohort. We developed a classifier using surface-based features to identify focal abnormalities of cortical development in a paediatric cohort. In addition to established measures, such as cortical thickness, grey-white matter blurring, FLAIR signal intensity, sulcal depth and curvature, our novel features included complementary metrics of surface morphology such as local cortical deformation as well as post-processing methods such as the "doughnut" method - which quantifies local variability in cortical morphometry/MRI signal intensity, and per-vertex interhemispheric asymmetry. A neural network classifier was trained using data from 22 patients with focal epilepsy (mean age = 12.1 ± 3.9, 9 females), after intra- and inter-subject normalisation using a population of 28 healthy controls (mean age = 14.6 ± 3.1, 11 females). Leave-one-out cross-validation was used to quantify classifier sensitivity using established features and the combination of established and novel features. Focal cortical dysplasias in our paediatric cohort were correctly identified with a higher sensitivity (73%) when novel features, based on our approach for detecting local cortical changes, were included, when compared to the sensitivity using only established features (59%). These methods may be applicable to aiding identification of subtle lesions in medication-resistant paediatric epilepsy as well as to the structural analysis of both healthy and abnormal cortical development.

Keywords: AUC, area under the curve; Automated classification; FCD; FCD, focal cortical dysplasia; FLAIR, fluid-attenuated inversion recovery; Intractable epilepsy; LCD, local cortical deformation; LGI, local gyrification index; PCA, principal component analysis; Paediatric; ROC, receiver operator characteristic; Structural MRI.


Figures

Fig. 1
Fig. 1
Example of “doughnut” method maps in a patient with a left middle frontal sulcus FCD. A) T1 image B) FLAIR image - manual lesion label in pink, white arrow indicates lesion. C) Inflated surface view with manual lesion label (orange) and example of 6 mm doughnut and circle. Upper panel – intra-subject normalised cortical thickness, grey-white matter contrast and FLAIR intensity (sampled at 50% cortical thickness) overlays around lesion area (white square). Lower panel – “doughnut” thickness, “doughnut” grey-white matter intensity and “doughnut” FLAIR (sampled at 50% cortical thickness). This lesion is characterised by a subtle increase in cortical thickness, though much less thick than the insula (bright yellow), subtle decrease in contrast at the grey-white matter boundary and no obvious FLAIR hyperintensity. “doughnut” thickness and “doughnut” grey-white matter intensity contrast highlight lesion, in this particular example “doughnut” FLAIR is of less use. All surface measures also identify other areas of cortex with extreme values and must therefore be used in combination.
Fig. 2
Fig. 2
Local cortical deformation. A) Surface overlay of per-vertex intrinsic curvature. The modulus of intrinsic curvature is summed within a 25 mm disc (grey circle) to calculate per-vertex local cortical deformation (B). C) Local cortical deformation is increased either due to increased sulci fundi (i.e. more folds) or small-scale surface deformation.
Fig. 3
Fig. 3
Overview of classifier. A) 1. Quantification of surface based features on each individual including established features – cortical thickness, FLAIR intensity (sampled at 6 cortical depths), grey-white contrast, curvature, sulcal depth – and novel features – “doughnut” method (for 6 FLAIR intensity samples, cortical thickness and grey-white contrast) and local cortical deformation (LCD). 2. Intra-subject normalisation (z-score). 3. Registration to the symmetrical template brain. 4. Per-vertex interhemispheric asymmetry calculations for each feature map. These serve to filter symmetrically extreme values such as thin primary sensory cortices. 5. Per-vertex normalisation by the controls of z-scored feature maps and asymmetry maps. These serve to filter common regional differences or asymmetries such as the planum temporale. * = feature undergoes steps 1, 2 and 5 only. ** = feature undergoes steps 1 and 2 only. B) 1. Volumetric lesion masks are manually segmented using T1 and FLAIR images. 2. Lesion masks are mapped to the surfaces and then to the symmetrical template brain. Lesional vertices are given a response value of 1, and contralateral non-lesional vertices are given a value of 0. C) 1. Neural network classifier is trained on surface based features and response values using leave one out cross-validation. Each row corresponds to a single vertex on one patient, each column to a surface based feature or the response variables.
Fig. 4
Fig. 4
Receiver operator characteristics and AUC for classifiers trained on individual established (A) and novel (B) features. Within established features, FLAIR signal intensity, cortical thickness and grey-white matter intensity contrast are most discriminatory of lesional vertices. Within novel features, interhemispheric FLAIR intensity asymmetry, grey-white matter contrast asymmetry and local cortical deformation are the most discriminatory of lesional vertices.
Fig. 5
Fig. 5
Examples of top cluster output in 5 patients with a radiological diagnosis of FCD. First column: T1-weighted images. Second column: FLAIR images. White circle on T1 and FLAIR images indicates lesion location. Third column: Top cluster of neural network classifier output (yellow) and manual lesion mask (light blue) viewed on pial surface, for large lesions, or inflated surface, for small lesions buried in sulci. For corresponding patient numbers in demographics table: A = 14, B = 15, C = 16, D = 9, E = 2.
Fig. 6
Fig. 6
Receiver-operating characteristics and AUC comparing classifiers trained on local cortical deformation and local gyrification index. Of the two measures of cortical folding, local cortical deformation is superior to local gyrification index in discriminating lesional vertices from non-lesional vertices.

References

    1. Ahmed B., Brodley C.E., Blackmon K.E., Kuzniecky R., Barash G., Carlson C. Cortical feature analysis and machine learning improves detection of ‘MRI-negative’ focal cortical dysplasia. Epilepsy Behav. 2015;48:21–28. - PMC - PubMed
    1. Bernasconi A., Antel S.B., Collins D.L., Bernasconi N., Olivier A., Dubeau F. Texture analysis and morphological processing of magnetic resonance imaging assist detection of focal cortical dysplasia in extra-temporal partial epilepsy. Ann. Neurol. 2001;49:770–775. - PubMed
    1. Bernasconi A., Bernasconi N., Bernhardt B.C., Schrader D. Advances in MRI for ‘cryptogenic’ epilepsies. Nat. Rev. Neurol. 2011;7:99–108. - PubMed
    1. Besson P., Andermann F., Dubeau F., Bernasconi A. Small focal cortical dysplasia lesions are located at the bottom of a deep sulcus. Brain. 2008;131:3246–3255. - PubMed
    1. Blümcke I., Thom M., Aronica E., Armstrong D.D., Vinters H.V., Palmini A. The clinicopathologic spectrum of focal cortical dysplasias: a consensus classification proposed by an ad hoc task force of the ILAE diagnostic methods commission1. Epilepsia. 2010;52:158–174. - PMC - PubMed

Publication types

Supplementary concepts