Radiolabeled inorganic nanoparticles for positron emission tomography imaging of cancer: an overview
- PMID: 28124549
- PMCID: PMC5477426
- DOI: 10.23736/S1824-4785.17.02969-7
Radiolabeled inorganic nanoparticles for positron emission tomography imaging of cancer: an overview
Abstract
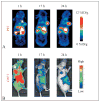
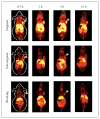
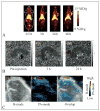
Over the last few years, a plethora of radiolabeled inorganic nanoparticles have been developed and evaluated for their potential use as probes in positron emission tomography (PET) imaging of a wide variety of cancers. Inorganic nanoparticles represent an emerging paradigm in molecular imaging probe design, allowing the incorporation of various imaging modalities, targeting ligands, and therapeutic payloads into a single vector. A major challenge in this endeavor is to develop disease-specific nanoparticles with facile and robust radiolabeling strategies. Also, the radiolabeled nanoparticles should demonstrate adequate in vitro and in vivo stability, enhanced sensitivity for detection of disease at an early stage, optimized in vivo pharmacokinetics for reduced non-specific organ uptake, and improved targeting for achieving high efficacy. Owing to these challenges and other technological and regulatory issues, only a single radiolabeled nanoparticle formulation, namely "C-dots" (Cornell dots), has found its way into clinical trials thus far. This review describes the available options for radiolabeling of nanoparticles and summarizes the recent developments in PET imaging of cancer in preclinical and clinical settings using radiolabeled nanoparticles as probes. The key considerations toward clinical translation of these novel PET imaging probes are discussed, which will be beneficial for advancement of the field.
Conflict of interest statement
Figures


Similar articles
-
Radiolabeling Silica-Based Nanoparticles via Coordination Chemistry: Basic Principles, Strategies, and Applications.Acc Chem Res. 2018 Mar 20;51(3):778-788. doi: 10.1021/acs.accounts.7b00635. Epub 2018 Feb 28. Acc Chem Res. 2018. PMID: 29489335 Free PMC article. Review.
-
Positron emission tomography imaging using radiolabeled inorganic nanomaterials.Acc Chem Res. 2015 Feb 17;48(2):286-94. doi: 10.1021/ar500362y. Epub 2015 Jan 30. Acc Chem Res. 2015. PMID: 25635467 Free PMC article. Review.
-
Exploring innovative strides in radiolabeled nanoparticle progress for multimodality cancer imaging and theranostic applications.Cancer Imaging. 2024 Sep 20;24(1):127. doi: 10.1186/s40644-024-00762-z. Cancer Imaging. 2024. PMID: 39304961 Free PMC article. Review.
-
Positron emission tomography and nanotechnology: A dynamic duo for cancer theranostics.Adv Drug Deliv Rev. 2017 Apr;113:157-176. doi: 10.1016/j.addr.2016.08.001. Epub 2016 Aug 9. Adv Drug Deliv Rev. 2017. PMID: 27521055 Free PMC article. Review.
-
Preclinical in vivo cancer, straightway to patients?Q J Nucl Med Mol Imaging. 2017 Jun;61(2):145-152. doi: 10.23736/S1824-4785.17.02974-0. Q J Nucl Med Mol Imaging. 2017. PMID: 28347131 Review.
Cited by
-
Preclinical PET tracers for the evaluation of sarcomas: understanding tumor biology.Am J Nucl Med Mol Imaging. 2018 Dec 20;8(6):428-440. eCollection 2018. Am J Nucl Med Mol Imaging. 2018. PMID: 30697463 Free PMC article. Review.
-
A Chelate-Free Nano-Platform for Incorporation of Diagnostic and Therapeutic Isotopes.Int J Nanomedicine. 2020 Jan 7;15:31-47. doi: 10.2147/IJN.S227931. eCollection 2020. Int J Nanomedicine. 2020. PMID: 32021163 Free PMC article.
-
Synthesis, Positron Emission Tomography Imaging, and Therapy of Diabody Targeted Drug Lipid Nanoparticles in a Prostate Cancer Murine Model.Cancer Biother Radiopharm. 2017 Sep;32(7):247-257. doi: 10.1089/cbr.2017.2253. Cancer Biother Radiopharm. 2017. PMID: 28910151 Free PMC article.
-
Brachytherapy at the nanoscale with protein functionalized and intrinsically radiolabeled [169Yb]Yb2O3 nanoseeds.Eur J Nucl Med Mol Imaging. 2024 May;51(6):1558-1573. doi: 10.1007/s00259-024-06612-1. Epub 2024 Jan 25. Eur J Nucl Med Mol Imaging. 2024. PMID: 38270686 Free PMC article.
-
Preliminary Evaluation of Iron Oxide Nanoparticles Radiolabeled with 68Ga and 177Lu as Potential Theranostic Agents.Nanomaterials (Basel). 2022 Jul 20;12(14):2490. doi: 10.3390/nano12142490. Nanomaterials (Basel). 2022. PMID: 35889715 Free PMC article.
References
Publication types
MeSH terms
Substances
Grants and funding
LinkOut - more resources
Full Text Sources

